Puzzle Pieces
 “Puzzle Pieces” include many of the ingredients in our more polished Data Puzzle lessons but in a format that offers teachers and their students space to play with and explore a larger dataset! Each Puzzle Piece includes 1) an embedded way to play with and explore the dataset, 2) context about the data and the scientists behind the data points, and 3) strategies to connect Puzzle Pieces to additional resources, including our scaffolded Data Puzzle lessons!
How to use Puzzle Pieces
Watch this video to learn how our scaffolded Data Puzzle lessons could be used before students engage with these more open-ended Puzzle Pieces.
Explore and play with the Puzzle Pieces below!
Snow conditions in the Colorado Rocky Mountains (1975-2022)
The Colorado River is fed largely by snowmelt in the Rocky Mountains. Therefore, to understand how much water could be in the Colorado River each year, we need to understand things like how much snow fell that year and when the snow melted (releasing water into the river). For more than forty years, billy barr, has measured total snowfall and the date of snowmelt from a set location in the East River Watershed in the Rocky Mountains. Explore billy's long-term snow datasets alongside seasonal temperature datasets to learn more about the climate factors impacting snow in the East River Watershed and reflect on what it might mean for the 40+ million downstream Colorado River water users.
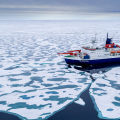
Amplified Warming in a Changing Arctic (2000-2021)
The Arctic is warming up to 4x faster than the rest of the world. Scientists like Dr. Jen Kay are racing to learn more about the factors causing the Arctic’s amplified warming. Fieldwork in the Arctic is extremely difficult because the Arctic is so remote and environmental conditions are so harsh. Instead, Dr. Kay relies on datasets collected from instruments attached to satellites. Explore these datasets: temperature (global and Arctic), Arctic sea ice extent, and Arctic albedo, to learn more about the changing Arctic climate system!
Poor air quality in Denver, CO experienced by some racial and socioeconomic groups more than others
Communities of color breathe Denver's worst air, that's the finding in a new paper published by atmospheric chemist Alex Bradley. To come to this conclusion, Alex and his colleagues determined the concentration two pollutants: nitrogen dioxide and particulate matter (NO2 and PM2.5) across the city of Denver and used 2020 census tracts to find a correlation between pollution and race. Explore these data and learn more about past discriminatory lending practices, known as redlining, that are linked to inequities in air quality today.
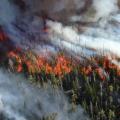
Fast and destructive wildfires in the United States (2012-2020)
Wildfires have dramatic impacts on both humans and ecosystems, from destroyed houses and forests to smoke pollution across large areas. While we know that large wildfires (>400ha) are burning more and more of the landscape in the western United States, considerably less is known about fast-moving fires. To learn more about the impact of fast fires on people and the environment, a team of scientists from the Earth Lab at the University of Colorado Boulder developed its own dataset to 1) determine which land cover types fast fires are move common in, 2) evaluate whether fast fast fires are more destructive than other wildfires, among discovered many other things along the way. Explore this fast fire dataset today!
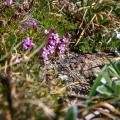
Moss campion (plant) phenology in the Rocky Mountains (2016-2021)
Moss campion, along with nearly all other high alpine wildflowers in the US Rocky Mountains are experiencing phenological shifts (e.g., timing of flowering, budding of leaves, onset of fruit ripening) in response to climate change. To come to this conclusion, Dr. Meredith Zettlemoyer, Dr. Megan DeMarche, and their team of scientists visited the same ~600 moss campion plants each year from 2016-2021 to measure the timing of life cycle events (e.g., flowering). Explore these data alongside average spring and July temperatures to learn more about the climate driving these phenologic shifts.