Snow conditions in the Colorado Rocky Mountains (1975-2022)
Explore the Data
| Phenomenon | Changing snow conditions in the Colorado Rocky Mountains from 1975-2022 |
| Location | Rocky Mountain Biological Laboratory in Gothic, Colorado (located in the East River Watershed) |
| Dataset | Total annual snowfall, Snowmelt day of the year, average winter, spring, and annual temperatures from 1975-2022 |
| Data Visualization Types | line graphs and scatter plots |
| Big Science Ideas | Climate change, water cycle |
How to play with the data below: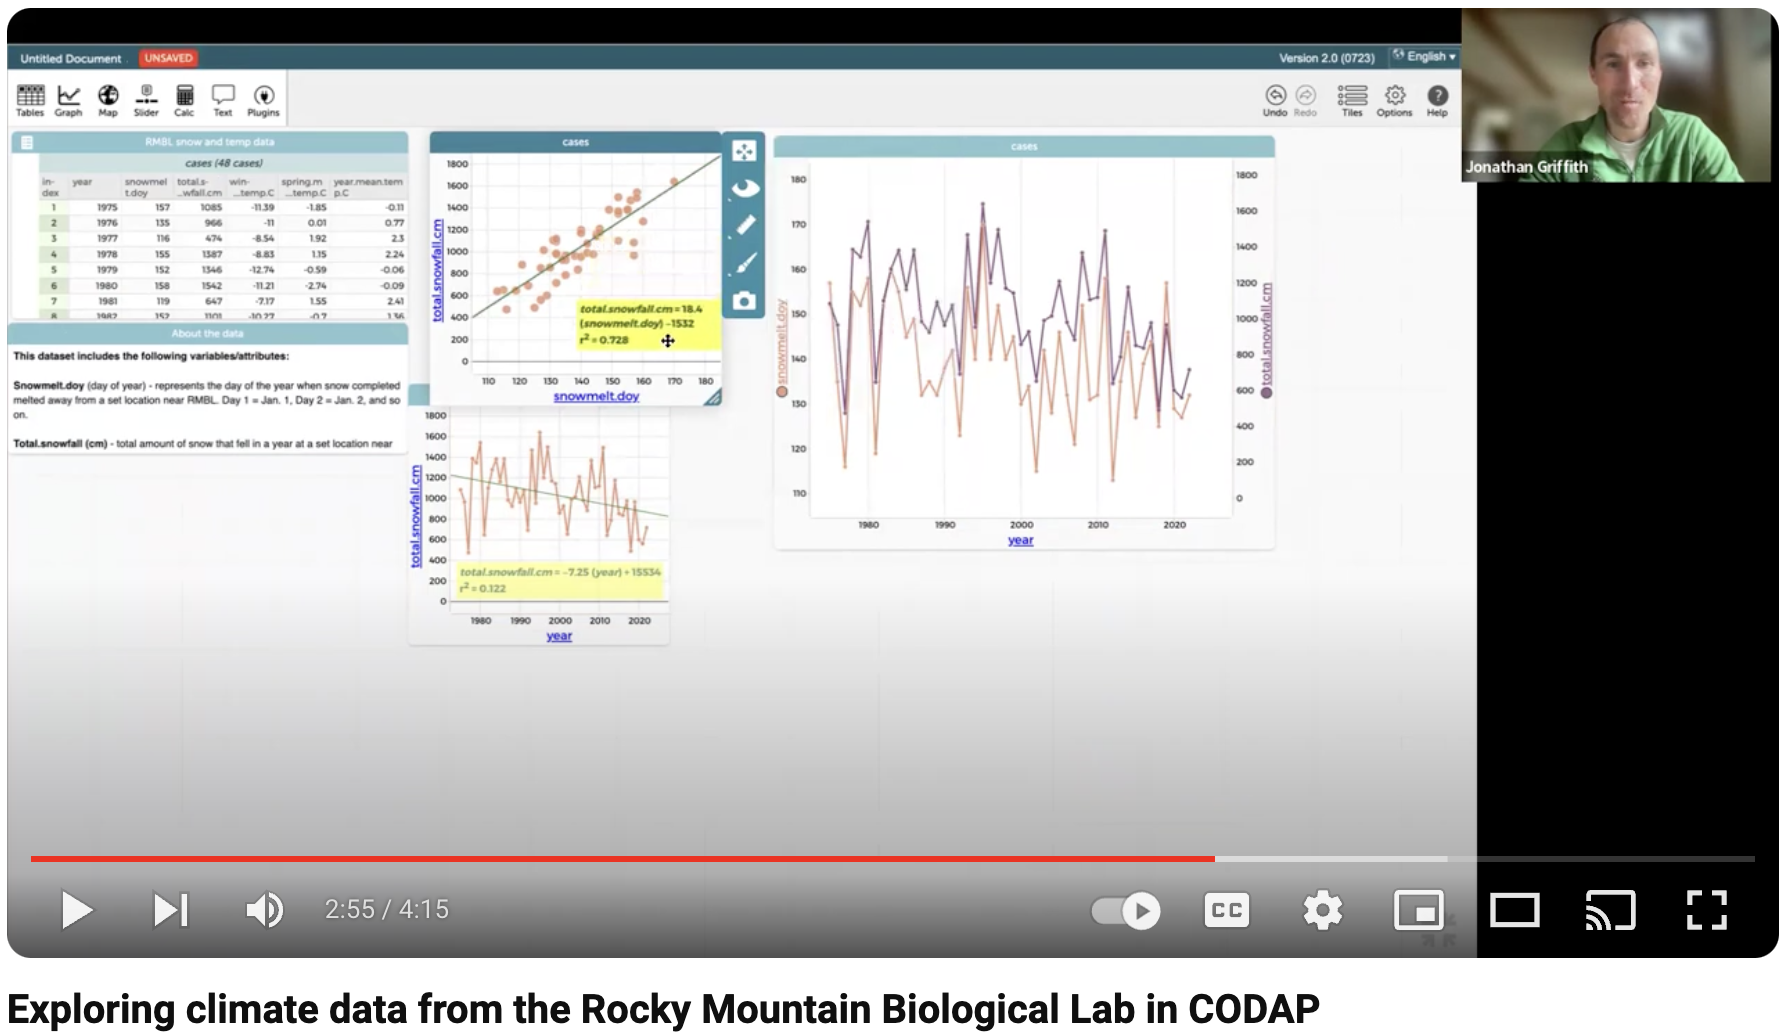
- Click and drag variables from the data table to the x and/or y axis to the pre-populated graphs or a create graph of your own by selecting the graph icon in the upper left corner of the window.
- Watch this video to learn more about leveraging the functionality of CODAP to explore the climate dataset below.
About the Data:
The data includes 6 variables about snow conditions (total snowfall and timing of snowmelt) and average seasonal and annual temperatures at the Rocky Mountain Biological Lab in Gothic, Colorado from 1975-2022.
Possible questions to consider when analyzing the data:
- How have snow conditions changed over time?
- How have seasonal temperatures changed over time?
- How do seasonal temperatures relate to snow conditions?
Some pattern(s) we notice/see/find:
- Total snowfall decreases over time
- Snowmelt day of the year decreases (melts earlier) over time
- Spring temperatures increase over time. Winter temperatures decrease over time.
- There is an inverse relationship between spring temperatures and snowmelt day of the year
What other pattern(s) did you notice/see/find?
_______________________________________________________________________________________________________
Data in Context
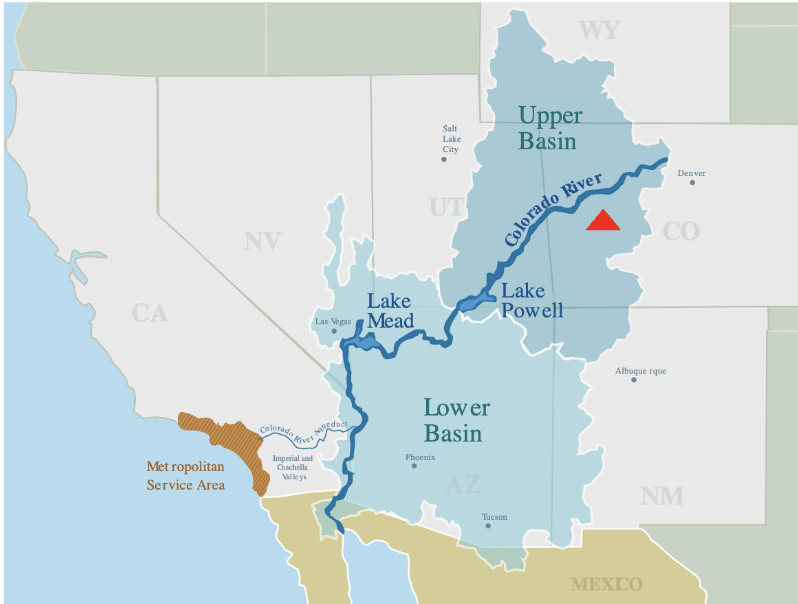
More than 40+ million people in the western United States rely on water from the Colorado River for drinking, agriculture, electricity, recreation, among other things. The Colorado River is fed largely from snowmelt in the Rocky Mountains, which are located in the Upper Basin of the Colorado River Watershed. Therefore, to understand how much water could be in the Colorado River each year, we need to understand things like how much snow fell that year and when the snow melted (releasing water into the river). To understand how much the amount of water in the Colorado River has changed over time, it is important to explore how snowfall and snowmelt is impacted by changing temperatures. Given the vastness of the Rocky Mountains it is impossible for us to measure everything everywhere. Instead scientists seek to first understand snow condition patterns in individual watersheds, like the East River Watershed (shown by the red triangle). Scientists then apply what they learn from this watershed to other watersheds in the Rockies. The ultimate goal is to be able to better predict how much water from Rocky Mountain snowmelt will enter the Colorado River each year.
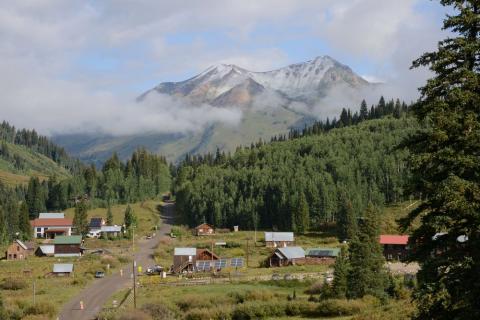
The Rocky Mountain Biological Laboratory (RMBL), located in the East River Watershed, was established in 1925 on the remains of an abandoned coal mine in Gothic, CO. Initially, established to study the local ecosystem, it has since grown into a world-renowned research facility with 70 plus buildings and hundreds of scientists flocking each year to conduct all sorts of research. While many scientists come and go, one of the area's most famous scientists, billy barr (he prefers his name to be spelled all lowercase), calls the place home and has since 1975.
_______________________________________________________________________________________________________
Meet the Scientist(s)
billy barr
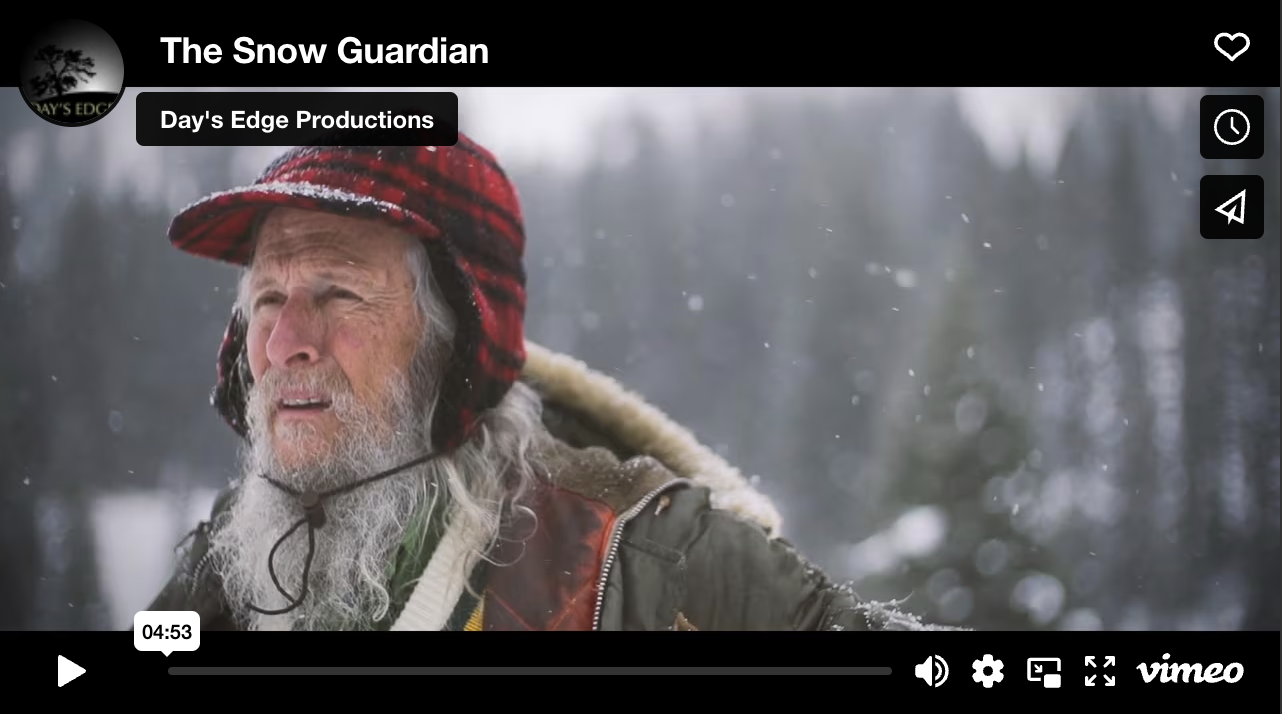
For over 40 years, billy barr lived alone in a small cabin adjacent to the RMBL in Gothic, Colorado. Gothic is one of the coldest and most isolated places in the United States. To keep busy, billy began recording snow levels. “The main thing I interacted with was the weather and the animals, so I just started recording things just cause it was something to do,” he says in this short film, The Snow Guardian, by Day's Edge Productions. “I had nothing to prove, no goals, no anything.” Climate researchers at the RMBL discovered that barr’s detailed records showed compelling evidence of climate change, and the data has been vital in understanding the severe impending effects of global warming.
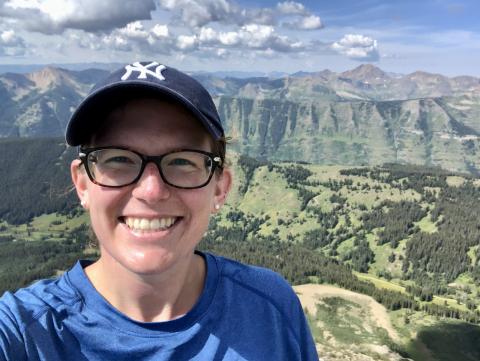
Dr. Rebecca Prather
Dr. Rebecca Prather is an ecologist who has spent many field seasons at RMBL collecting flower data to understand how climate change is affecting the seasonal activity (phenology) of a variety of flowers. While Dr. Prather really enjoyed the fieldwork she expressed that she found the asscoiated data processing work to be equally fascinating saying, “I liked thinking about how you format and combine all these different data sets to draw accurate conclusions — the problem-solving part of it.”
Dr. Prather's love for data processing has inspired her to organize and curate datasets so that the public can explore the data for themselves. To that end, she and her collaborators have carefully organized snow data collected by billy barr and curated temperature data from NOAA's weather station in Crested Butte for the public to engage with. These data are included in this resource!
- Read more about how Dr. Prather fell in love with RMBL and data science here.
_______________________________________________________________________________________________________
Data Collection
Total snowfall - For more than 40 years, billy barr has recorded daily snowfall totals at a set location at RMBL. At the end of each winter season, barr adds up these daily snowfall numbers to figure out the total snowfall each winter.
Snowmelt day of year - For more than 40 years, billy barr has been monitoring the timing of snowmelt at a set location at RMBL. The location becomes covered in snow in the late fall and remains covered through the winter until the spring or early summer. The day of the year when the snow melts away from this set location, revealing completely bare ground, is called the snowmelt date. Day 1 of the year is January 1st, Day 2 is January 2nd, and so on and so forth. You can use this Day of the Year Calendar to convert day of the year data to an actual calendar date. For example, the earliest the snow melted completely away from the set location at RMBL was day 113 (or April 23rd) in 2012. The latest the snow has completely melted away from the set location at RMBL was day 170 (or June 19th) in 1995.
Temperature - Seasonal and annual temperature data is from weather stations in Crested Butte, CO, about 10 km from the Rocky Mountain Biological Lab. There are temperature data from RMBL; however, the temperature record doesn’t extend back to 1975 (when billy barr started gathering snow data).
- Spring temps - average of March, April, May temperatures
- Summer temps - average of June, July, August temperatures
- Fall Temps - average of September, October, November temperatures
- Winter Temps - average of December, January, February temperatures
_______________________________________________________________________________________________________
Classroom Connections and Supports
The total snowfall and timing of snowmelt datasets included here have also been embedded into the Snow in the Rockies Data Puzzle lesson. Teachers may choose to have students engage with the Snow in the Rockies Data Puzzle first to identify patterns in changing snow conditions before then letting students explore the snow condition data alongside temperature data in this Puzzle Piece. Students may find patterns between seasonal temperatures (e.g., spring temperatures) and snow condition data (e.g., timing of snowmelt), which may help them explain WHY snow conditions in the East River Watershed are changing over time.