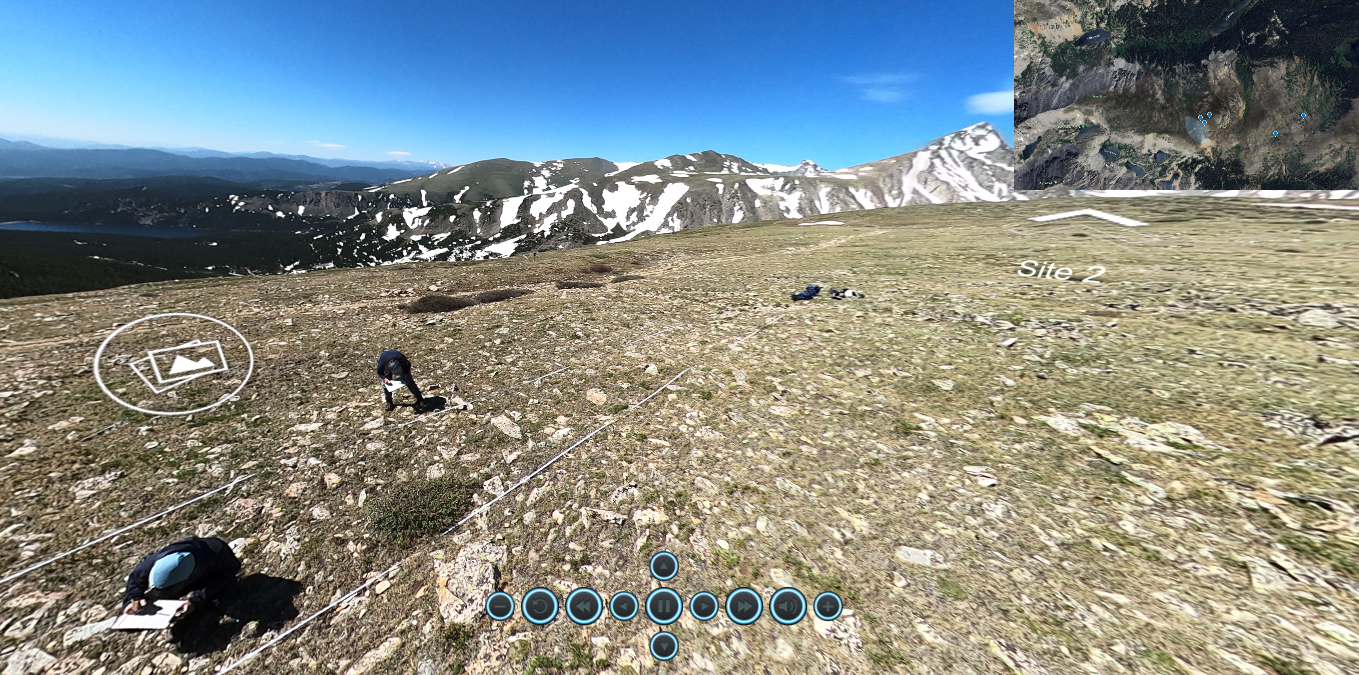
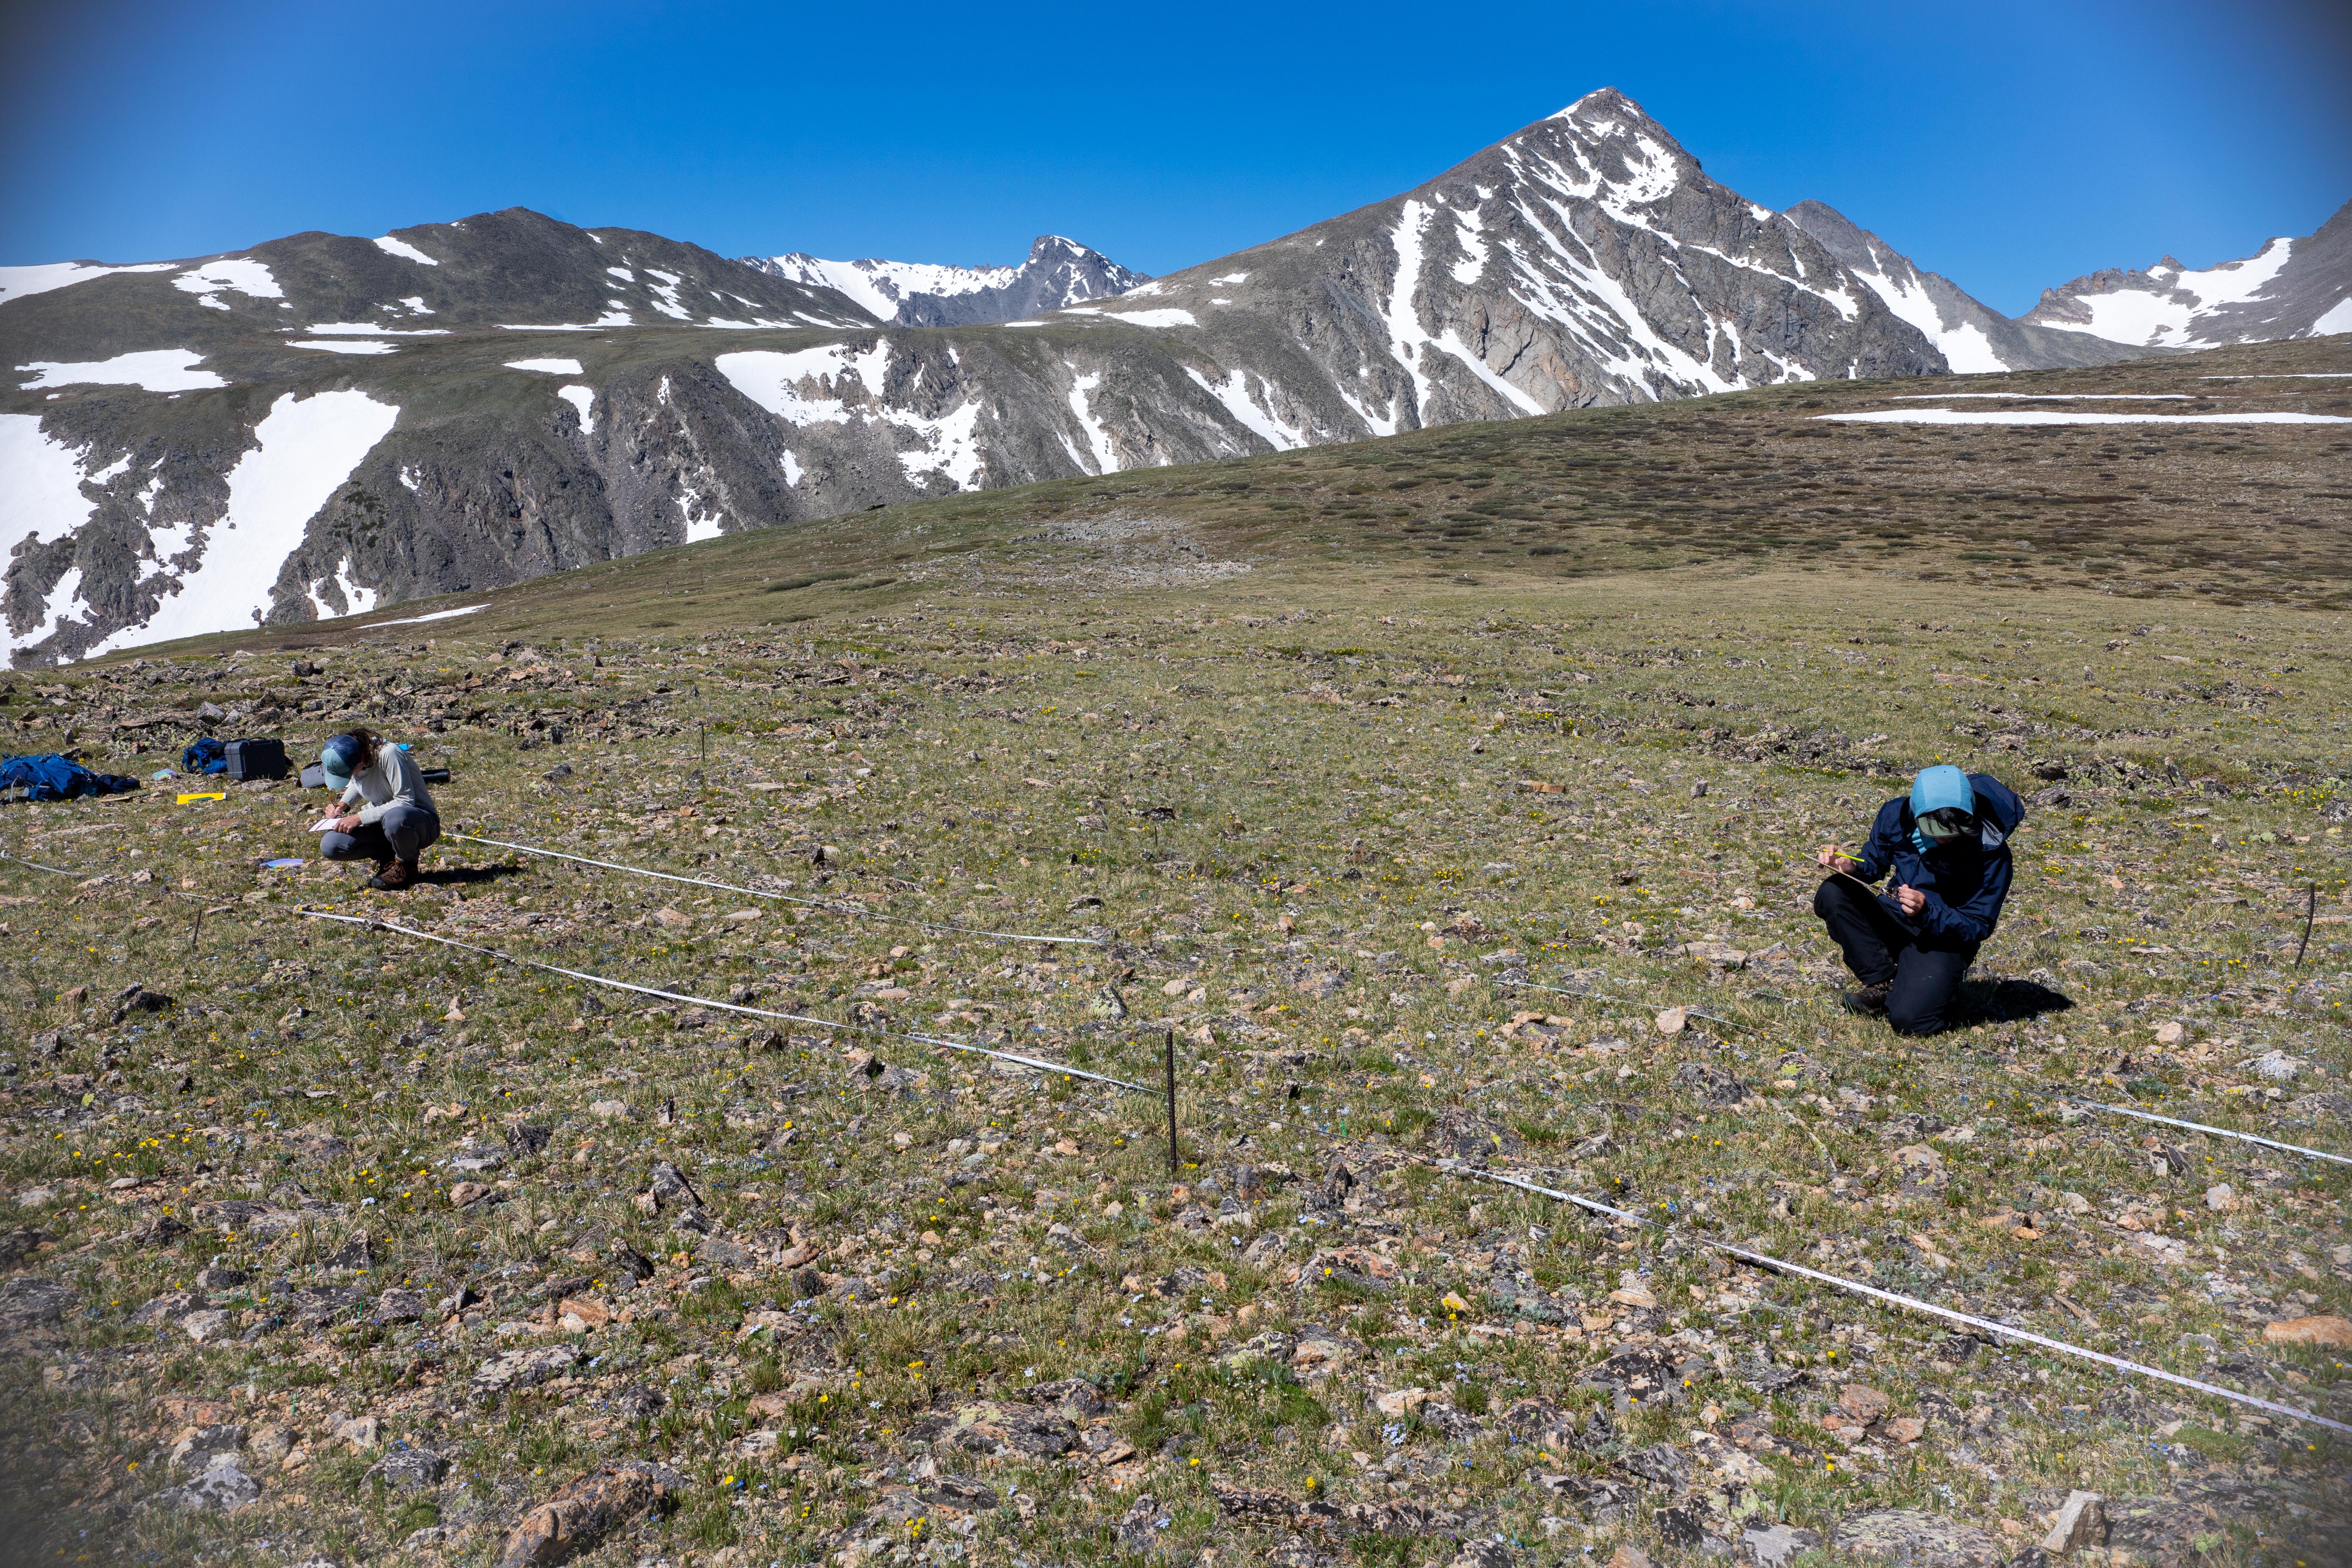
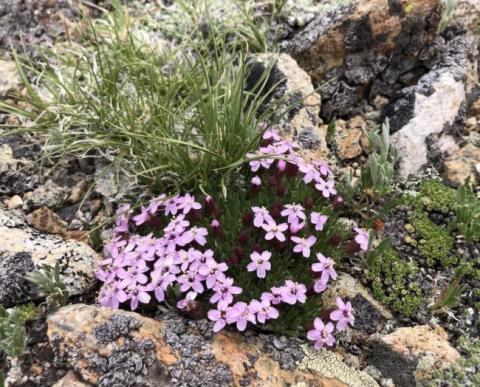
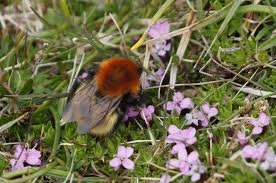
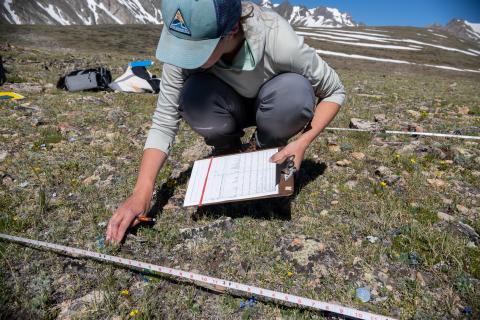
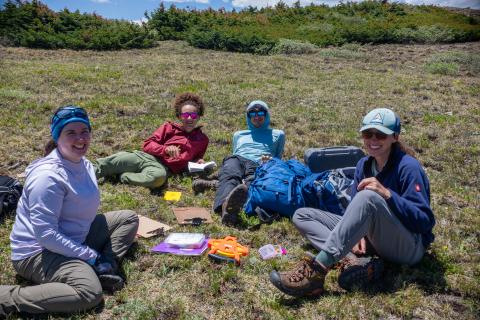
Moss campion (plant) phenology in the Rocky Mountains (2016-2021)

Image
Moss campion

Explore the Data

PhenomenonPhenology shifts in moss campion, a common Rocky Mountain plant (2016-2021)
Location

Niwot Ridge, Colorado

Datasets

Phenology data: Moss campion flowering from 2016-2021 

Vital sign data: Moss campion reproduction from 2016-2021

Environmental data: Snowmelt and temperature data from 2016-2021

Data Visualization TypesScatter plots, line plots
Big Science IdeasChanges to environmental conditions affect populations


How to play with the data below:

  • Click and drag variables from the data table to the x and/or y axis to the pre-populated graphs or create a graph of your own by selecting the graph icon in the upper left corner of the window. 
  • Watch this video to learn more about leveraging the functionality of CODAP to explore the moss campion phenology dataset below.


                                                   Google Sheets                                                 What is Google Slides? | Technology Enhanced Learning at SHU

Data in CODAP                                      Data in Google Sheets                         Graphs in Google Slides

The data above includes variables about moss campion phenology: timing of moss campion flowering and average reproduction rates; and environmental conditions: timing of snowmelt, average seasonal temperature, average July temperature; at four different field sites (SN1, SN2, SN3, SN4) across Niwot Ridge in Colorado from 2016-2021. 

Visit these four field sites in this virtual field trip!

Niwot virtual field trip

Possible questions to consider when analyzing the data:

  • How does the timing of first flower relate to average spring temperature and average snowmelt day?
  • How does moss campion reproduction relate to average spring temperature, average snowmelt day, and average July temperature?
  • What environmental conditions (e.g., temperature, snowmelt) lead to the higher average reproduction values?

Some pattern(s) we notice/see/find:

  • First flower blooms earlier in the year when the snow melts away earlier in the year.
  • First flower blooms earlier in the year when average spring temperatures are higher.
  • Average reproduction is higher when the snow melts later in the year.
  • Average reproduction increases with decreasing average spring temperatures.
  • Average reproduction increases with increasing average July temperature.

What other pattern(s) did you notice/see/find?

_______________________________________________________________________________________________________

Data in Context

The US Rocky Mountains stretch from Canada to northern New Mexico, a distance of more than 3,000 miles, and consist of ~184 peaks with elevations ranging from 8,000 to more than 14,000 feet above sea level. Environmental conditions such as temperature and precipitation vary greatly across this 3,000 mile long mountain range, and thus, the Rockies are home to a mixture of habitats including alpine tundra habitats at the highest elevations (see image right), grasslands at the lowest elevations, and lots of conifer forest habitat at the elevations in between. These habitats support an incredible diversity of plants and animals, including more than 900 plant species, 300 bird species, and 60 mammal species (including elk and moose). Each of these plants and animals has adapted to survive and thrive in specific habitats with specific environmental. 

Alpine tundra
Image

Moss campion adaptations

For example, moss campion (pictured here) is found on mountain tops in the alpine tundra, a habitat characterized as a cold, dry, and treeless. Moss campion's low profile and cushion shape helps it survive here by creating an environment that is warmer and wetter than the surrounding soil. This microclimate not only benefits moss campion but also other tundra plants that grow in and around moss campion to take advantage of these warm/wet conditions.

All living things are connected

Not only have the plants and animals of the Rockies adapted to live in habitats with specific temperature and precipitation conditions, but they have also adapted to live with each other. For example, each spring, when temperatures rise and the snow melts away, beautiful wildflowers bloom. Bees and other insects wake up from their winter dormancy, emerging from the ground to drink the sweet nectar from these flowers, and in doing so spreading pollen from one flower to the next. Having migrated to warmer climates in the winter, birds return to the Rockies to lay their eggs, relying on the abundance of insects for food. The life cycles of all living things in the Rockies are connected, in some way, shape, or form.  Picture by Mike Pennington.

Bee
Niwot map

Phenology

But climate change is changing these life cycles and scientists are racing to understand how changing environmental conditions across the Rockies may impact things like the timing each spring when plants produce flowers, which can have cascading effects on other organisms. Changes in the timing of events are referred to as “phenological shifts”. One way to measure these phenological shifts is to observe how a living thing, like plants, responds to their environment by visiting the same plant population year after year to measure the timing of a life cycle event, like flowering. This is exactly what a group of scientists did from 2016-2021, visiting four alpine tundra field sites across Colorado’s Niwot Ridge (~35 miles east of Boulder) to observe and measure important life cycle events of a common alpine tundra plant called moss campion.

Learn more about Niwot Ridge here.

Moss campion life cycle

Common throughout the Rocky Mountain alpine tundra, moss campion plants begin to flower after the winter snow melts away and spring temperatures warm up. The bright pink flowers of moss campion attract a variety of insects who fly from plant to plant, drinking nectar and spreading pollen thereby aiding in moss campion reproduction. If pollinated, some flowers will turn into fruits (often in July) that hold an abundance of seeds. The fruits open in August, releasing the seeds which spread across the landscape via wind. Snow returns to the Colorado Rockies in September/October, covering the ground and forcing moss campion plants into a state of dormancy…only to be awakened when the snow melts and temperatures rise following spring. 

  • But how will the life cycle of moss campion be impacted by changing climate conditions? 
  • Will the moss campion's pink flowers bloom earlier in the springs as temperatures increase and the snow melts earlier? 
  • Will an earlier spring bloom impact the ability of moss campion to produce fruits?
  • Will higher summer temperatures affect the ability of moss campion to produce fruits and disperse seeds?

Let’s meet the scientists hoping to answer these and other questions about the impacts of climate change on these important alpine tundra plants…

Image

Image

_______________________________________________________________________________________________________

Meet the Scientists

Image

Dr. Meredith Zettlemoyer

Dr. Meredith Zettlemoyer is an assistant professor in ecology at the University of Montana who studies how plants respond to changes in climate like snowmelt, temperature, and wildfire. She is really interested in the ways plants can adjust to new conditions, like by changing when they flower, and is excited about how this information can help us conserve sensitive or threatened wildflower species.

Initially a journalism major, Meredith switched her focus to ecology after spending a summer working at a state park teaching visitors about marshes...she was hooked! She has since conducted research on wildflower species throughout the United States. In 2020, she joined a team of scientists studying the impacts of climate change on moss campion at Niwot Ridge...work she continues to do to this day! 

Image

Dr. Megan DeMarche

Dr. Megan DeMarche is an Assistant Professor of plant ecology at the University of Georgia studies the impacts of climate change on plants and how they may or may to be adapting to rapid changes. She is motivated to use the data she gathers to help improve plant conservation efforts. Megan began studying alpine plants as a postdoctoral research at the University of Colorado Boulder in 2016, and has been monitoring the phenology of wildflowers at Niwot Ridge ever since!

Learn more about her journey as a scientist, starting from her time undergraduate at UC Santa Cruz where she first caught the "botany bug" as she calls it, in this "In Defense of Plants" podcast.

Data Collection


VariableDescription

Year

Year of data collection (2016-2021)

Site

Moss campion data were collected from four different sites across Niwot Ridge (SN1, SN2, SN3, SN4)

Day of first flower (average)

Average day of the year when the first flower was produced at each of the four sites.

The scientists recorded when the moss campion plants across the four sites produce their first flower (~600 plants total). They do this by visiting each plant every 2-3 days and visually inspecting it for open flowers. Then, they average the date of the first flower across individual plants found at each site. 

Note: Use this table to convert day of the year numbers to a standard date.

Reproduction rate (average)

Average number of fruits/year/log(plant area in cm^2) of moss campion plants at each of the four sites.

At the end of each summer, the scientists count the number of fruits produced by each individual moss campion plant and measure the area of each of these plants across the four sites. Then, the scientists divide the number of fruits by the log(area of the plant) to get a reproduction rate for each plant. Finally, they average the reproduction rate across individual plants found at each site. 

Day of snowmelt (average)

Estimated day of the year when the snow melted away from the site.

The scientists placed HOBO temperature loggers, which are portable instruments that can be placed outside to record the temperature every few hours. They use these data to estimate when temperatures become warm enough that snow would have melted out of each of the four sites.

Note: Use this table to convert day of the year numbers to a standard date.

Temperature in °C (average)

Local surface soil temperatures were recorded by HOBO temperature loggers. Temperature data were averaged across each of the four sites and are presented here in two temperature metrics the scientists predicted could be informative for phenology:

Average spring temperature - average temperature between April 1 to June 15; April 1 represents the date before snowmelt in any year, and June 15 represents a date close to the start of flowering most years.

  • Predicted to impact the timing of flowering

Average July temperature

  • Predicted to impact reproductive success


Classroom Connections and Supports

Image

Teachers may choose to engage their students with this Puzzle Piece AFTER having already engaged their students with The Tipping Point lesson. In The Tipping Point, students explore the relationship between moss campion reproduction rates and July temperatures by analyzing long-term dataset (~20 years) collected from study sites in Alaska, Colorado, and New Mexico. The data show that moss campion reproduction rates increase with as July temperatures increase but only up to a certain temperature, beyond which, moss campion reproduction rates decrease. However, students may wonder how July temperatures are impacting moss campion reproduction rates at a single location (e.g., Colorado). Or, if climate changes might be impacting moss campion in other ways (e.g., the timing of flowering). These are wonderings that can be exploring in this Moss Campion (plant) Phenology in the Rock Mountains Puzzle Piece. 

Additional Resources

Publications (the data presented in this Puzzle Piece were published in the following paper)

A Long-Lived Alpine Perennial Advances Flowering under Warmer Conditions but Not Enough to Maintain Reproductive Success - Paper authored by Dr. Meredith Zettlemoyer and others including Dr. Megan DeMarche.

Data Visualizations and Interactives

  • Leaf and Bloom Dates - Explore this EPA Climate Indicator to see how the timing of first leaf (lilac) growth for and flower (honeysuckle) blooms for two widely distributed plants in the contiguous United States. 
  • Seasonal Temperature Change - Explore this EPA Climate Indicator to observe trends in average temperatures for each season across the United States from 1896-2023.
  • Snow Cover - Explore this EPA Climate Indicator to study changes in the length of the snow cover season in the United States from 1972-2013.
  • Snow Conditions in the Rocky Mountains (1975-2022) Puzzle Piece - For more than forty years, billy barr, has measured total snowfall and the date of snowmelt from a set location in the East River Watershed in the Rocky Mountains. Explore billy's long-term snow datasets alongside seasonal temperature datasets to learn more about the climate factors impacting snow in the East River Watershed and reflect on what it might mean for the 40+ million downstream Colorado River water users.

Phenology shifts at the Rocky Mountain Biological Lab in Gothic, CO (~100 miles SE of Niwot, CO)