Amplified Warming in a Changing Arctic (2000-2021)
Explore the Data
| Phenomenon | Rapid warming and declining sea ice in the Arctic from 2000-2021 |
| Location | Arctic (70-90° latitude) |
| Dataset | Earth and Arctic temperature anomalies, average summer Arctic sea ice extent, average summer Arctic albedo |
| Data Visualization Types | Line graphs and scatter plots |
| Big Science Ideas | Climate change, feedback loops, albedo |
How to play with the data below: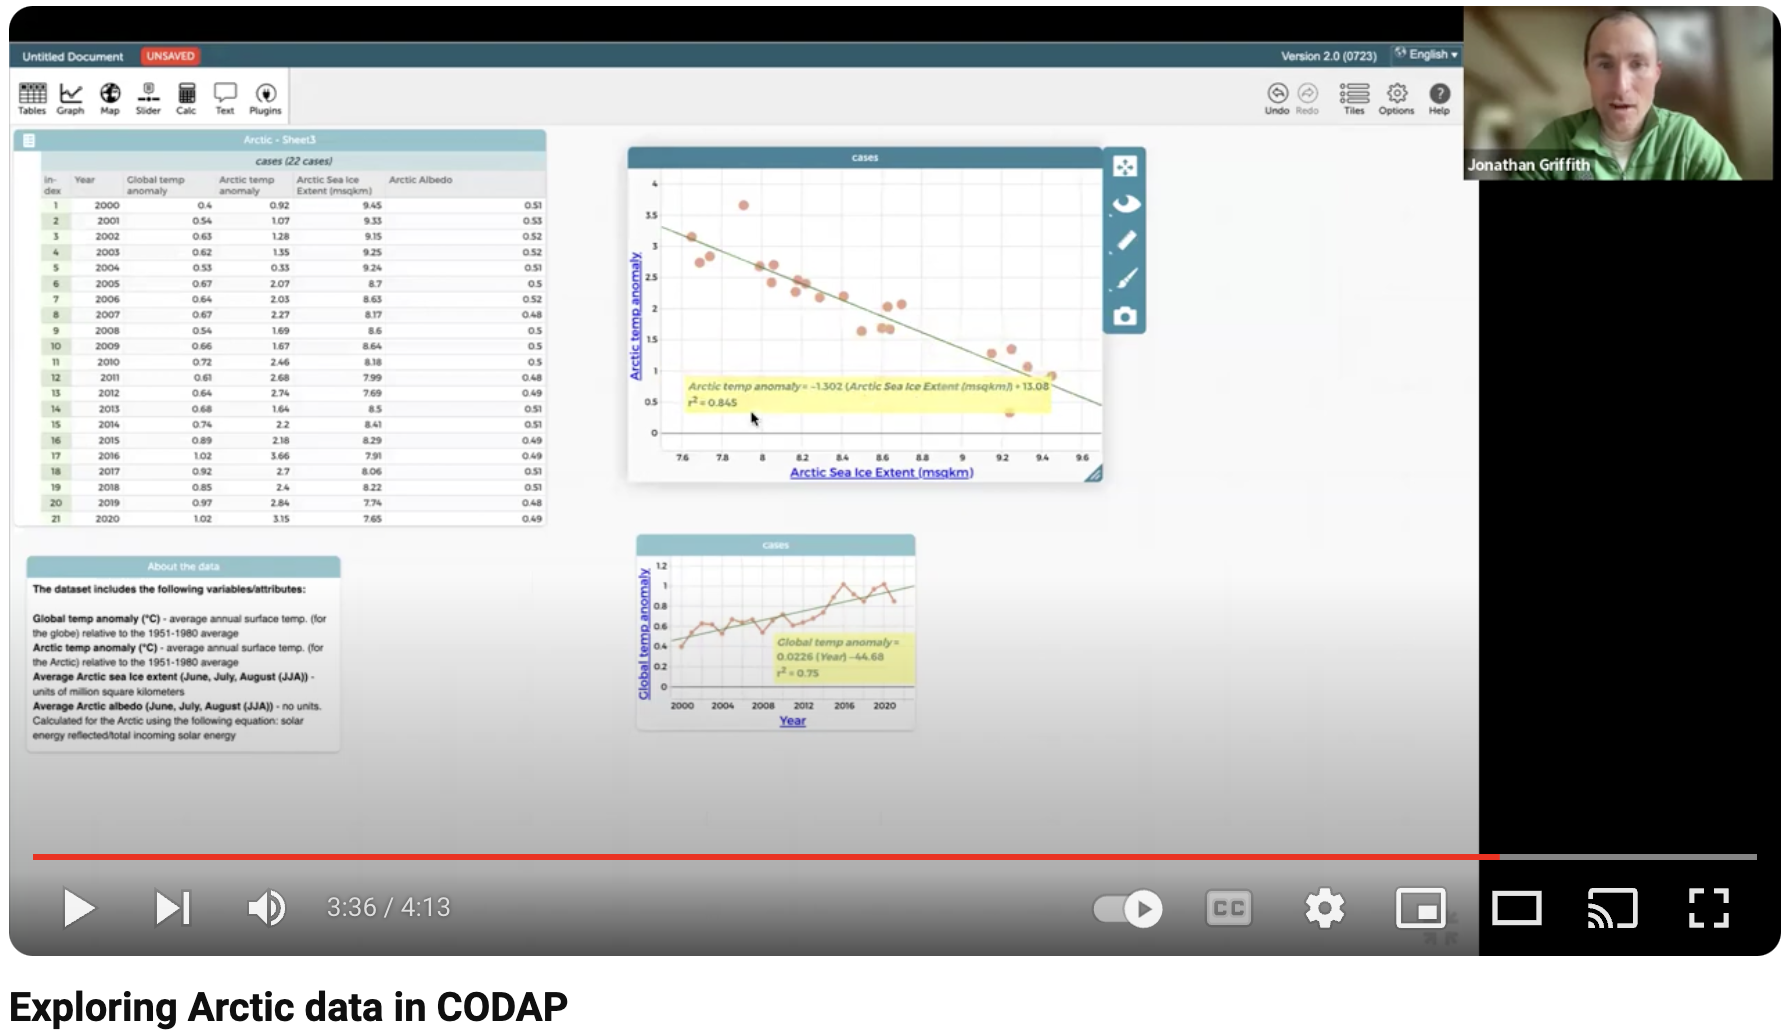
- Click and drag variables from the data table to the x and/or y axis to the pre-populated graphs or a create graph of your own by selecting the graph icon in the upper left corner of the window.
- Watch this video to learn more about leveraging the functionality of CODAP to explore the Arctic climate dataset below.
About the Data:
The data below show changes in annual temperature for the Earth and the Arctic, average summer sea ice extent, and average summer albedo from 2000-2021.
Possible questions to consider when analyzing the data:
- How have temperatures (Earth and Arctic) changed over time?
- How do temperatures relate to summer sea ice extent?
- How does summer sea ice extent relate to summer albedo?
Some pattern(s) we notice/see/find:
- Global temperatures increase from 0.4-1°C relative to 1951-1980 average
- Arctic temperatures increase from 1-4°C relative to 1951-1980 average
- Average summer Arctic sea ice extent is decreasing
- Average summer albedo in the Arctic is decreasing
What other pattern(s) did you notice/see/find?
_______________________________________________________________________________________________________
Data in Context
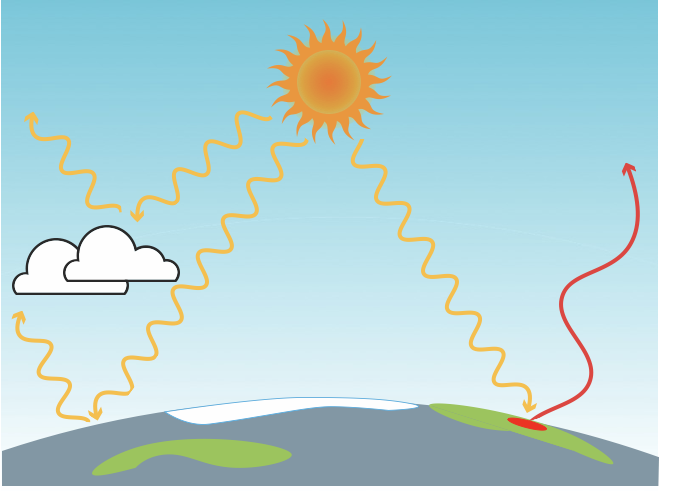
The Earth’s energy budget describes the balance between the energy that is reaching the Earth from the Sun and the energy that is reflected away (albedo) or absorbed and later emitted by the Earth, which flows back out into space. In the simplest sense, if this energy budget stays balanced, Earth’s temperature stays consistent. Rising global temperatures over the past century indicate that Earth’s energy budget is out of balance. This energy imbalance is not equal across Earth’s surface. For example, scientists have observed that the Arctic is heating up at a rate faster than the global average, a phenomenon known as Arctic amplification.
The Arctic, the northernmost region on Earth, is warming up to 4 times faster than the rest of the world. Scientists are racing to learn more about the factors causing the Arctic’s amplified warming; however, fieldwork in the Arctic is extremely difficult because the Arctic is so remote and environmental conditions are so harsh (average winter temperatures in the central Arctic are -34°C/-30°F). Increasingly, scientists are gathering Arctic datasets from instruments attached to satellites that can measure things like temperature (global and Arctic), Arctic sea ice extent, and even the amount of solar energy that is reflected off the surface of the Arctic (albedo).
- Watch this video to see how global temperatures have changed from 1880 to the present.
_______________________________________________________________________________________________________
Meet the Scientist(s)
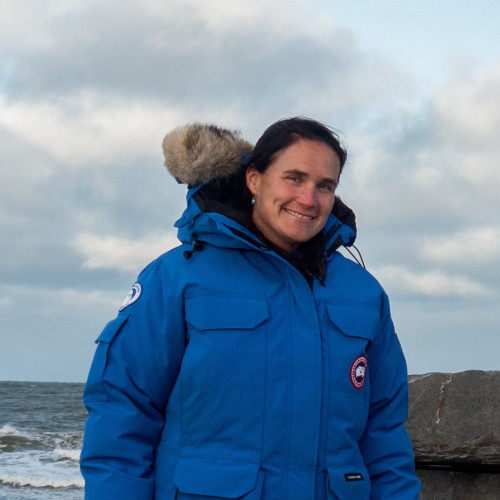
Dr. Jen Kay
Dr. Jen Kay is an atmospheric scientist who researches Arctic climate change. Dr. Kay says she has always been drawn to the Arctic because 1) she likes things that are cold, and 2) because there is no place on Earth that is changing more rapidly. Dr. Kay’s work focuses on improving our understanding of the ways in which clouds and sea ice impact the Arctic climate system. She uses data gathered both from satellites and scientists in the field to develop more accurate climate models to help us better understand the processes controlling climate change and climate variability in the Arctic.
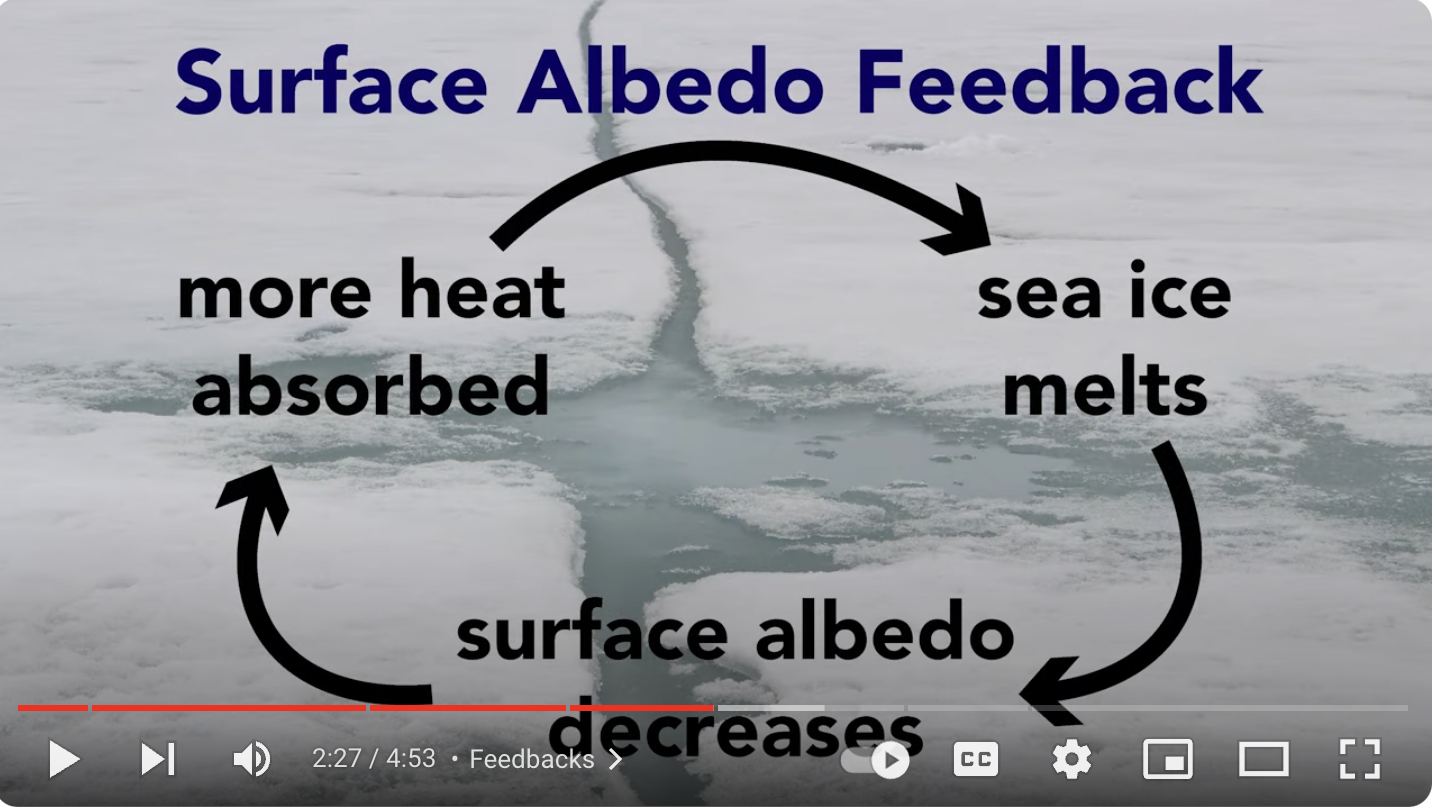
Dr. Kay is also extremely passionate about connecting the students (K-16) and the public to her work through outreach. Most recently, she developed an amazing video called Arctic Feedbacks, that describes the surface albedo feedback loop, a process contributing to the Arctic’s amplified warming. Dr. Kay has co-developed several Data Puzzle lessons and most recently curated the datasets included in this Puzzle Piece!
_______________________________________________________________________________________________________
Data Collection
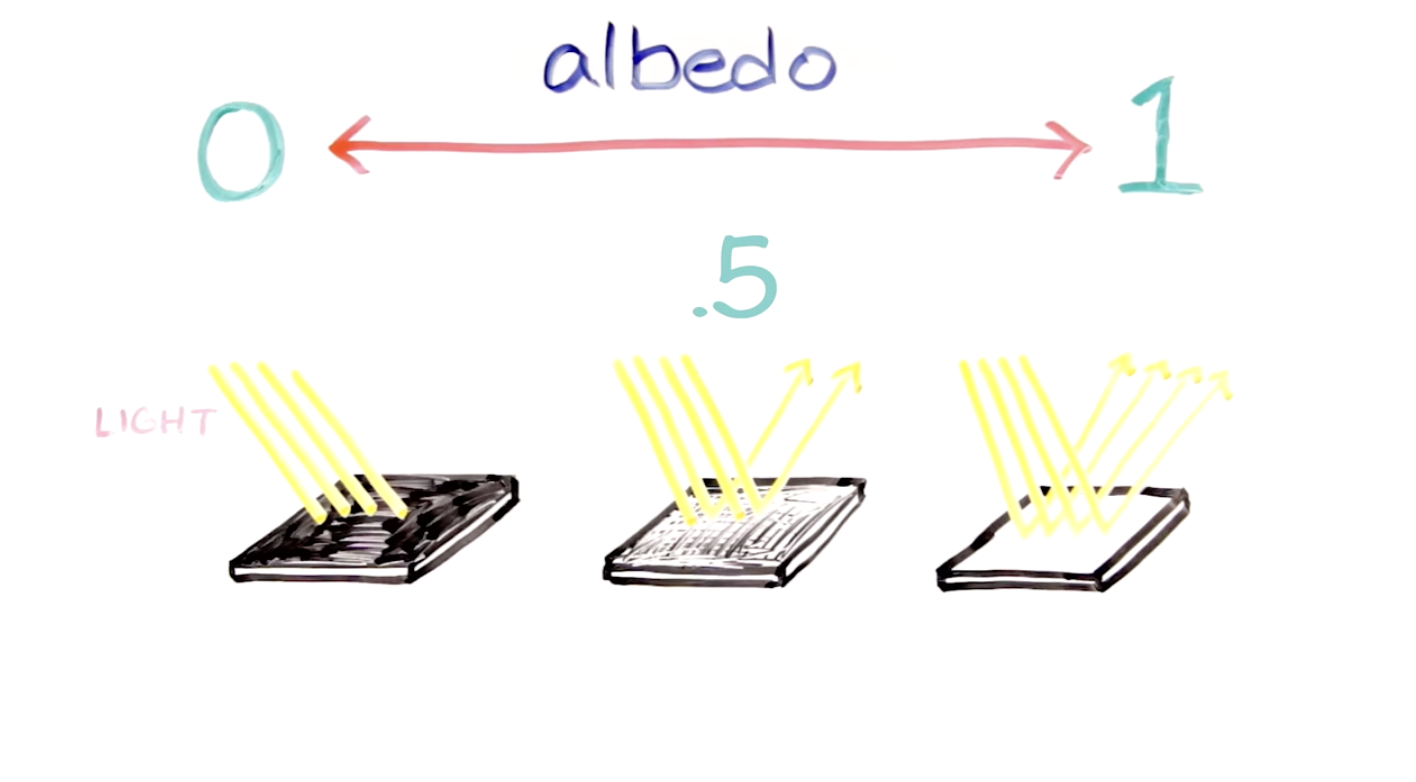
Albedo - Albedo is the measure of the reflectivity of a surface and is calculated using the following equation:
Albedo = Solar energy reflected/Total incoming solar energy
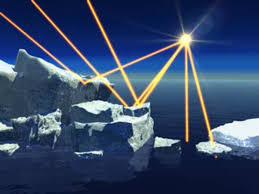
Instruments on board NASA satellites (Aqua, Terra, and Suomi NPP) measure the amount of solar energy reaching the Earth and the amount of solar energy reflected off of the Earth. Dr. Kay has taken this massive dataset (incoming and outgoing solar energy for the entire globe) and curated it to include only the Arctic (70°- 90° latitude). For this resource, she used the curated Arctic data to calculate average albedo. Albedo values included in the "Explore the Data" section above represent the average albedo during the summer (June, July, August), when the amount of sunlight reaching the Arctic is at its peak. Note that during the winter months, the Arctic receives little to no sunlight.
Visit NASA satellites Aqua, Terra, and Suomi NPP in this interactive!
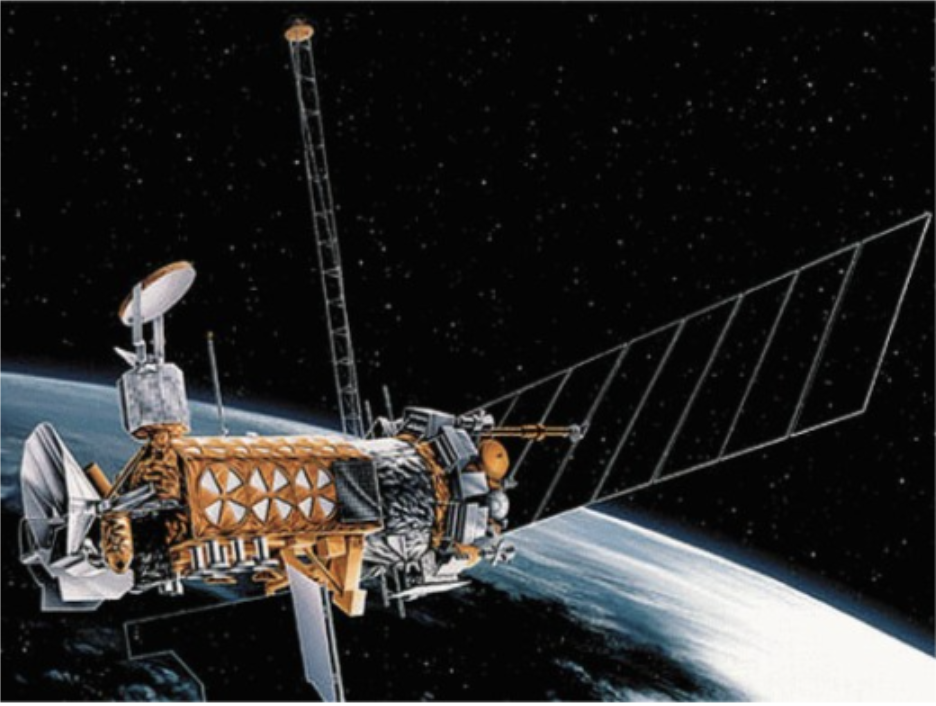
Arctic Sea Ice Extent - The average summer (June, July, August) Arctic sea ice extent dataset comes from instruments aboard Defense Meteorological Satellite Program (DMSP) satellites. These low, Earth-orbiting satellites provide the military with important environmental information that can be used in strategic and tactical weather prediction that aids the US military in planning operations at sea, on land and in the air. Data from the DMSP satellites is also used by the National Oceanic and Atmospheric Administration (NOAA) scientists as part of a long-term meteorological program. In it's nearly 50 year history, there have been 19 DMSP satellites, 16 of which are retired. The three satellites currently operational in the series, DMSP F-16, DMSP F-17, and DMSP F-18. Instruments used to capture the Arctic sea ice extent data in this Puzzle Piece can be found on the DMSP, F-17, and DMSP F-18 satellites.
Image (right) is an artist's view of the deployed DMSP 17 satellite. Credit: US Air Force.
Arctic and Global temperature anomalies (annual) - Dr. Kay calculated the annual temperature anomaly from the GISS Surface Temperature Analysis (GISTEMP), which is an estimate of global surface temperature change. Temperature changes are expressed as anomalies. In this resource, each year’s temperature anomaly value is the difference between that year’s average temperature and the overall average temperature from 1951-1980. Scientists often use anomalies because they more accurately describe climate variability over larger areas and they give a frame of reference that allows for more meaningful comparisons between locations.
- Find more information about global temperature anomalies here.
_______________________________________________________________________________________________________
Classroom Connections and Supports
The datasets included here have also been embedded into other Data Puzzle lessons. The albedo and sea ice extent datasets are included in the To Reflect or Not to Reflect Data Puzzle and the Arctic temperature anomaly dataset included in the On a Budget Data Puzzle. Before engaging students with this Puzzle Piece, I would recommend engaging students with the On a Budget Data Puzzle so that students can explore the changing Arctic energy budget before challenging them to think about a mechanism driving Arctic amplification with this Puzzle Piece, that being the decline in sea ice and subsequent decrease in albedo.