Fast and destructive wildfires in the United States (2012-2020)
Explore the Data
| Phenomenon | Wildfire speed and its relationship to fire size, land cover type, cost and destruction of property, and geography |
| Location | Contiguous United States |
| Dataset | 7 variables from 4,988 wildfires from the 2012-2020 period. |
| Data Visualization Types | Scatter plots, line plots |
| Big Science Ideas | Fire ecology, human impacts |
How to play with the data below:
- Click and drag variables from the data table to the x and/or y axis to the pre-populated graphs or create a graph of your own by selecting the graph icon in the upper left corner of the window.
- Select the map icon to see wildfire locations across the contiguous U.S.
- Click and drag variables from the data table onto the map to visualize the spatial distribution across the U.S.
- Watch this video to learn more about leveraging the functionality of CODAP to explore the wildfire dataset below.
About the Data:
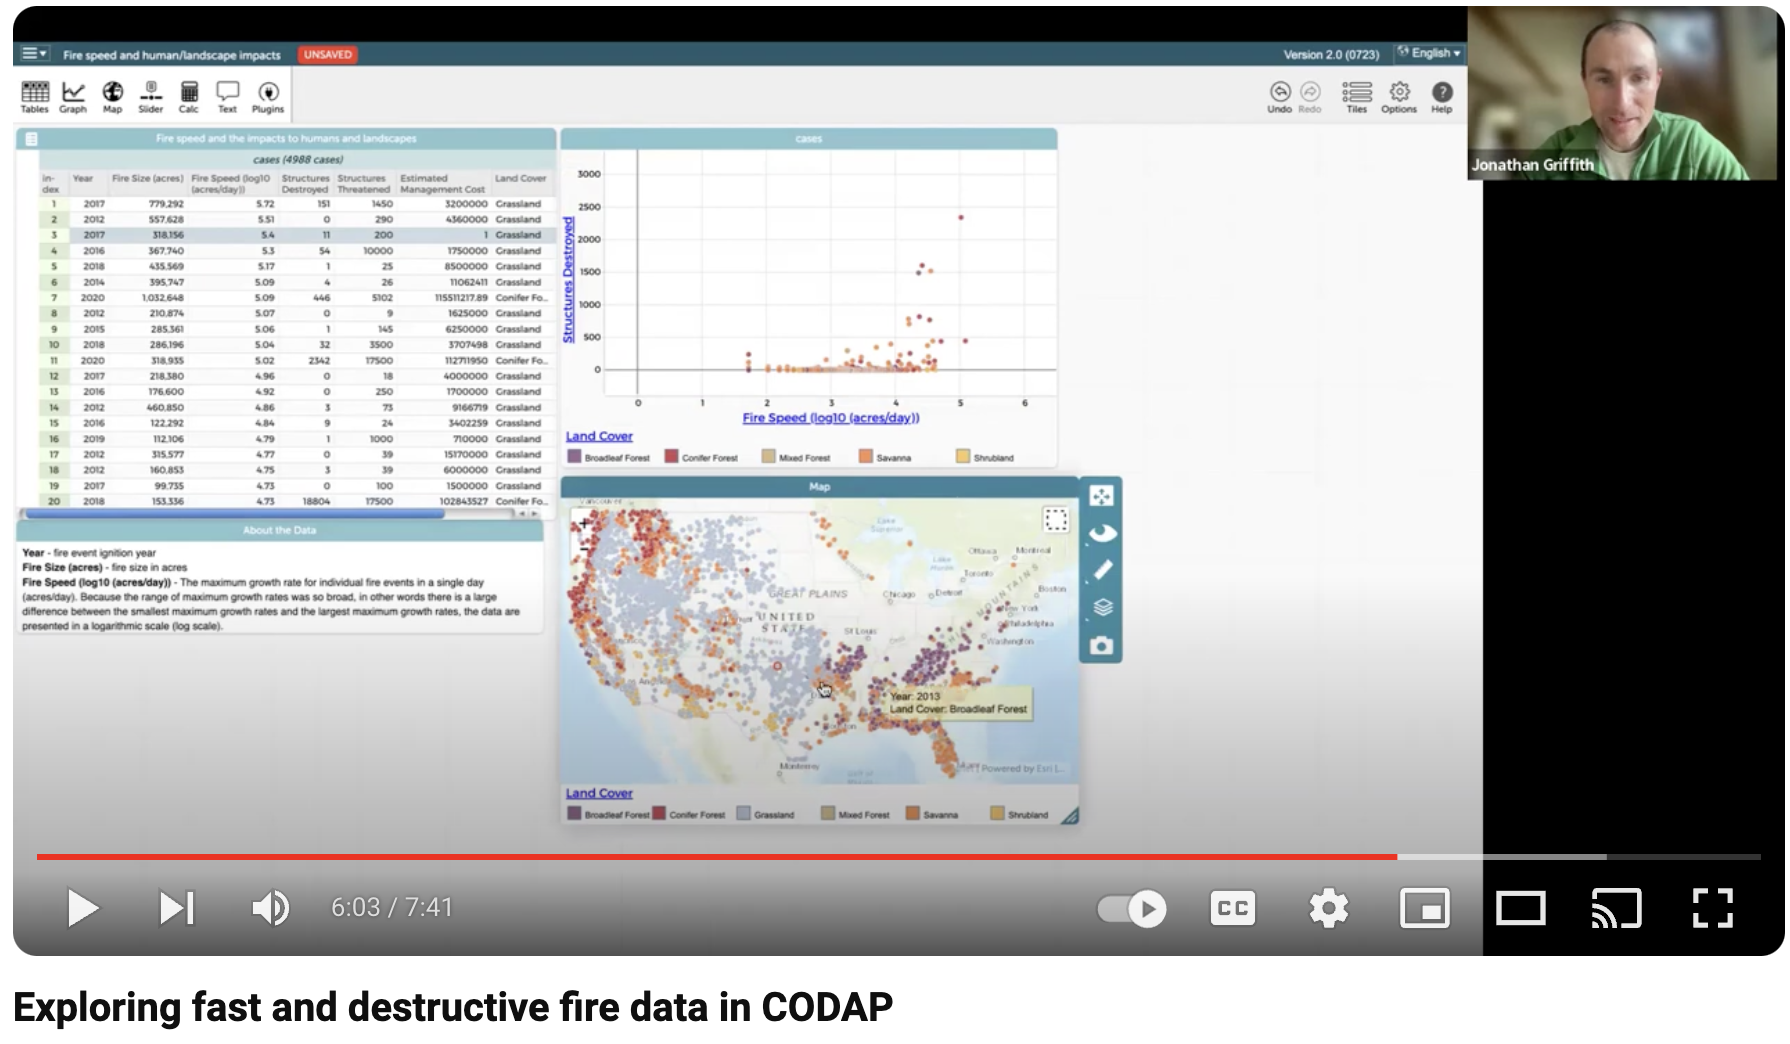
The data below includes 7 variables for wildfires (prescribed burns were excluded to the greatest extent possible) that threatened or destroyed human structures in the contiguous United States over the 2012-2020 time***. These wildfire variables include, location: latitude and longitude, size: acres burned, speed: log (maximum growth rate in acres), human impact: number of structures destroyed and threatened, estimated management cost, and land cover type (e.g., conifer forest, grassland).
***These data are derived from satellite imagery and mined from public archives. The satellite imagery and public archives used are both available during the window from 2001-2020. However, for this Puzzle Piece, a modern temporal subsection of the data (2012-2020) was selected because there is a significant lag in CODAP when using the tool to analyze datasets that are over 5,000 points in length.
Possible questions to consider when analyzing the data:
- How does the maximum fire growth rate relate to the size of the fire (acres burned)?
- How does the maximum fire growth rate relate to the number of structures destroyed by a wildfire?
- How does the maximum fire growth rate relate to the estimated management cost associated with each wildfire?
- Which land cover types experience the highest maximum fire growth rates?
- In which parts of the U.S. do the very fastest fires occur?
- How fast, large, and expensive are the fires near you?
Some pattern(s) we notice/see/find:
- Fires with higher maximum growth rates (speeds) are more likely to be larger in size (acres burned)
- Fires with higher maximum growth rates (speeds) are more likely to destroy more structures
- Fires with higher maximum growth rates (speeds) are more likely to have higher estimated management costs
- Grassland land cover types have the highest maximum growth rates (speeds)
What other pattern(s) did you notice/see/find?
_______________________________________________________________________________________________________
Data in Context
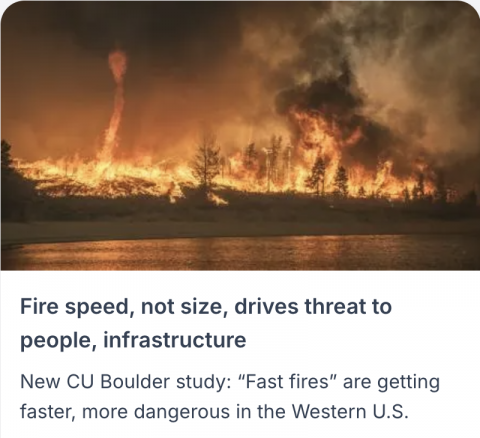
Wildfires have dramatic impacts on both humans and ecosystems, from destroyed houses and forests to smoke pollution across large areas. We know that fire suppression practices and the increase/expansion of invasive species have changed fire-evolved landscapes and that climate change is drying these fire fuels out - leading to larger and more severe fires across the United States. At the same time, humans are building more homes into what scientists call the ‘wildland-urban interface,’ putting more people at risk than ever before. In order to reduce the impact of fires and improve community preparedness, it is key for us to understand the characteristics that lead to the most destructive wildfires. Image source.
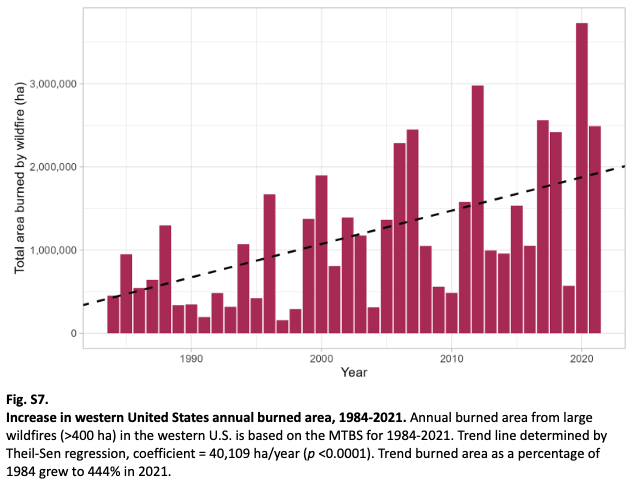
Although people sometimes lump all fires together, there are dramatic differences between them. Fires can be large or small, incredibly hot-burning or less intense, and fast-moving or slow-moving. While we know that large wildfires (>400ha) are burning more and more of the landscape in the western United States, considerably less is known about fast-moving fires. Some of the most destructive wildfires in U.S. history have occurred in recent years. The 2018 Camp fire in California ripped through a conifer forest and destroyed more than 16,000 homes. A few years later, the 2021 Marshall Fire, burned rapidly through the grasslands of Colorado destroying more than a thousand homes in less than 12 hours. While these fires took place in very different land cover types, their location at the interface of wildlands and human settlement made them a threat to local communities, while the speed at which the fires expanded made suppression difficult or impossible and ultimately led to widespread destruction.
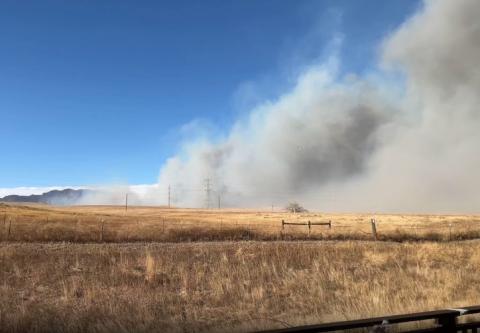
2021 Marshall Fire - Superior and Boulder County, Colorado
Pictured here is a screenshot of this video filmed by Matteo Rebeschini of smoke blowing through the grassland behind his Colorado home on December 30th, 2021. Moments later the winds shifted and smoke engulfed his home. "It looked like someone switched off the lights outside," he said. Video was downloaded from the Colorado Sun.
2018 Camp Fire - Butte County, California
This image was taken by the Landsat 8 satellite only four hours after a small fire started in the forest along Camp Creed Road. The image uses a wavelength of light that humans can't see to show the active fire front and hotspots below fire cover.
Combining multiple datasets allows scientists to investigate new questions. To learn more about fast fires, a team of scientists from the Earth Lab group at the University of Colorado Boulder developed its own dataset, called the Fire Event Delineation (FIRED) dataset, that enabled them to explore how fast fires move at a national scale. The team also developed a dataset to quantify the number of structures exposed and/or destroyed by individual fire events. This dataset, called the ICS209+, was mined from the US National Incident Management System. By using both datasets, the scientists defined fast fires as those that grew faster than 4,000 acres/day, an area about the size of 325 football fields. Fires expanding at this speed, or faster, occurred in only 2.7% of all wildfires in the FIRED dataset, but accounted for 78% of total structures destroyed and 61% of total suppression costs. Other questions the scientists investigated with this combined dataset include:
Where do fast fires occur geographically?
In which land cover type are fast fires most common?
Are fast fires more destructive than other wildfires?
Are fast fires larger (burning more acreage) than other wildfires?
How is fire speed changing over time?
Let's meet the scientists hoping to answer these and other questions about the impacts of fast fires on humans and landscapes...
Meet the Scientists
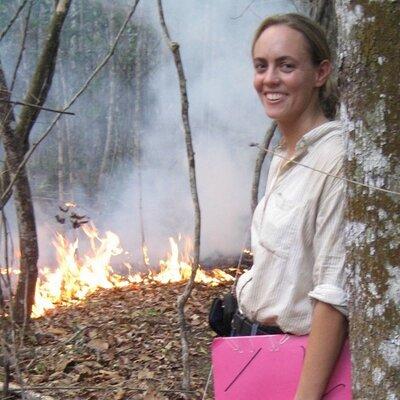
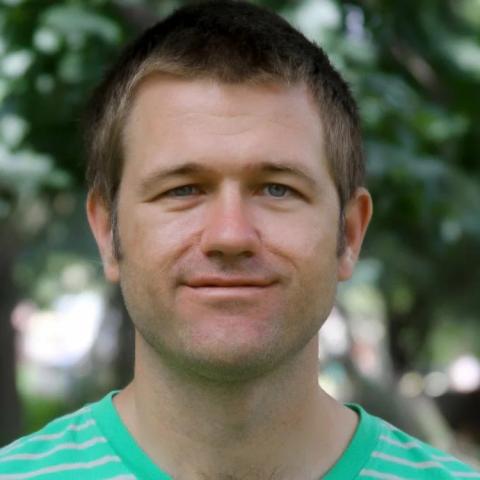
Dr. Jennifer Balch
Dr. Balch is a fire ecologist and the Director of Earth Lab, a group at the University of Colorado Boulder whose mission is to harness the power of big datasets, from satellites to social media, to understand global environmental change better manage and adapt. Dr. Balch’s research focuses on understanding shifting fire regimes (patterns in wildfire frequency, intensity, size) and their consequences. While she has conducted research in the field of fire ecology all over the world, the 2021 Marshall Fire in Colorado, which occurred very close to her home, showed her that there is still much to understand about fast moving fires near urban interfaces. Image source.
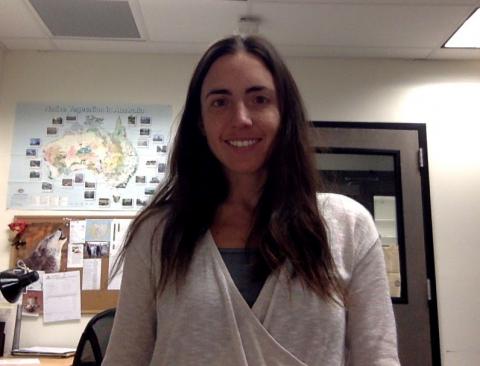
Dr. Virginia Iglesias
Dr. Iglesias is an environmental data scientist who specializes in combining data from multiple sources to understand what causes changes in the environment and how those changes affect people. For her PhD, she studied how the relationship between people and fire changed over time, and it became clear that fire is central to human life. For thousands of years, we have cooked, heated our homes, managed the landscape for hunting and farming, shaped metals, and generated energy, all with fire. Fire is also extremely important to keep ecosystems healthy. But not everything about fire is positive. It threatens people’s health, lives, and homes, and the persistence of some plants and animals. This dual nature of fire made her wonder what properties of fire make it a priceless tool, and which characteristics make it dangerous.
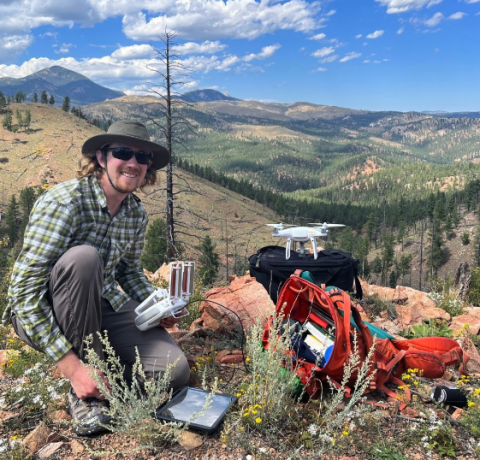
Dr. Adam Mahood
Dr. Adam Mahood is an ecologist with a particular love for plants. Dr. Mahood has worked in a variety of ecosystems, all prone to natural wildfires, and has been able to see first-hand the immediate impacts of fire on humans and the landscape, including many rare plant species that only come out after fires! Inspired by his love for plants, Dr. Mahood uses big data to understand which landscapes (e.g., conifer forest, grassland) are most susceptible to fast fires, and then also how these landscapes recover after these destructive fire events.
Tyler McIntosh
Tyler is an interdisciplinary environmental scientist with a passion for understanding the ways in which humans and natural systems interact. Tyler grew up in the mountains of Wyoming, where he accepted that wildfires and wildfire smoke were a normal part of life in the summer. He remembers seeing flames in a canyon “uncomfortably close to my house”, and playing in the charcoal left over from nearby burns. It wasn’t until later in life that he realized that wildfire patterns are changing dramatically and that there is an urgent need to identify and create more sustainable solutions to support humans to live with wildfire. Before solutions can be created, Tyler believes it’s critical that the public understand the changing wildfire patterns that he and many others have discovered. To that end, Tyler worked tirelessly with Puzzle Piece developer, Jon Griffith, to generate the subset of data published in this resource and to work with Jon to make sure the science presented here is sound. Thank you, Tyler!!!
The scientists listed above are only part of a larger team that collaborated to develop and analyze the FIRED and ICS209+ datasets to learn more about fast fires and their impacts on humans and the landscape. By bringing together a team with different perspectives and strengths, lead scientist Dr. Balch understood that they would be able to identify, access, and clean the large, freely-available datasets necessary to answer their questions about fast fires.
_______________________________________________________________________________________________________
Data Collection
The dataset presented in this Puzzle Piece is a subset of the much larger combined FIRES and ICS209+ datasets developed by Dr. Balch and her colleagues. The FIRED dataset was developed using freely available data derived from the MODIS satellite and then used to determine the extent of wildfires (burn area), land cover type, and to calculate fire growth rates. The ICSD209+ dataset on how many homes were threatened or destroyed during fire events, and the estimated management costs associated with these fire events, were extracted from Government Situational Reports (ICS-209).
| Variable | Description |
Year | Fire event ignition year |
Acres burned | Number of acres burned in the fire event. This data is derived from MODIS satellite imagery of active fires. (Acres) |
Log maximum growth rate acres | The logarithm of maximum growth rate acres. This is a mathematical transformation of the data that makes it easier to visualize data sets that contain extreme values. (log(Acres/Day)) |
Structures destroyed | The number of human buildings destroyed by the fire event. This data is from government National Incident Management Reports, which document fire event impacts, firefighting resources, and more. |
| Structures threatened | Estimate of the maximum number of buildings that may have been impacted within the next seventy-two hours at any time during the fire event. |
Estimated management cost | The estimated total cost of incident management; in other words, the cost of fighting the fire. These costs include firefighting resources such as personnel and aircraft and fire engine support, as well as costs incurred from evacuation coordination, active fire monitoring analysis, and similar activities. This data is from government National Incident Management System reports. |
Land cover | The type of ecosystem most common within the fire event perimeter. This data is from a land cover classification derived from MODIS satellite imagery. |
Latitude | A geographic coordinate specifying north-south position on the globe. |
Longitude | A geographic coordinate specifying east-west position on the globe. |
Classroom Connections and Supports
Data Puzzle Connection
"Megafire" is a term that is used frequently by the media but can have many different meanings to describe extreme wildfires from, intensity, duration, speed, and most commonly size. In the Megafires: Rare Occurrences or the New Normal? Data Puzzle lesson, students explore how the number of megafires, as defined by their size (>20000 football fields), has changed over time and how climate change and fire suppression practices have contributed to this change. However, the work from Dr. Balch and her team suggests that megafires should also be defined by how fast they grow because speed of fire growth matters more than the size of the fire for destroying and threatening structures - a finding that can be explored in this “Fast Fires” Puzzle Piece.
- Teachers might consider engaging students with the more structured Megafires: Rare Occurrences or the New Normal? Data Puzzle lesson before this “Fast Fires” Puzzle Piece to have students 1) explore how changing climate and fire management practices has led to a rise in the number of megafires over time (as defined by fire size), and 2) consider for themselves whether fire size or fire speed should be used to define what is and what is not a megafire.
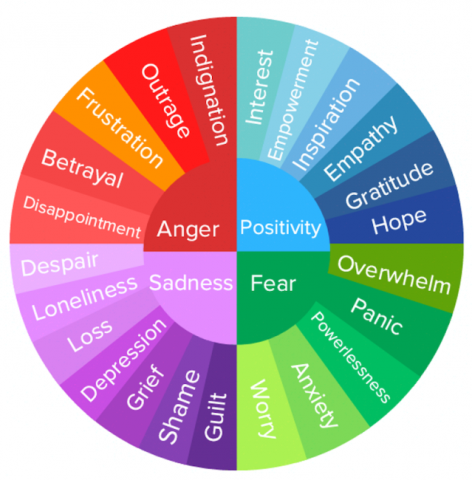
Climate Mental Health
Wildfire can be a sensitive topic for young people, especially those who have been directly impacted by them. While it's important to invite students into these conversations, it's even more important to allow them to choose their level of engagement. To support teachers and students address the strong emotions and reactions that can be elicited during discussions related to natural hazards and/or climate change, our CIRES EEE team, with support from the Climate Mental Health Network, developed a series of youth-friendly resources.
As part of this "Fast Fires" Puzzle Piece, teachers may choose to engage students with "The Emotions Wheel" activity to create a safe space for students emotions that may arise when processing the impacts of wildfire.