Data Puzzles Lessons

Not All Warming is Equal
The dramatic increase in atmospheric carbon dioxide has caused global temperatures to rise by more than 1.1°C (~2°F), but not all warming is equal. In this Data Puzzle, students analyze temperature and atmospheric carbon dioxide datasets to construct explanatory models for the following question, "Are the places on Earth where atmospheric carbon dioxide has increased the most also the same places where temperatures have increased the most"
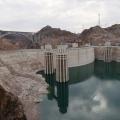
Megadrought in the Colorado River Basin
Much of the western United States is experiencing drought conditions. In this Data Puzzle, students analyze authentic climate data to construct explanatory models for the investigative question, "What is causing the megadrought in the Colorado River Basin?" Image credit: Ethan Miller/Getty Images.

The Tipping Point
Moss campion is a hearty tundra plant that lives over a wide range of latitudes from New Mexico all the way up to Alaska. For more than twenty years, ecologists have been tracking the vital rates (survival, growth, and reproduction) of moss campion from four study sites. In this Data Puzzle, students analyze a long-term dataset (moss campion reproduction rates and July temperatures) to investigate the question, "How is moss campion reproduction affected by temperature?" Questions like this one can give scientists insight into how these plants might be impacted by climate change.
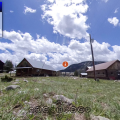
Snow in the Rockies
Water from snowmelt high in the Rocky Mountains feeds into the Colorado River, a river system that more than 40 million people rely on for water. In this Data Puzzle, students analyze snowfall and snowmelt datasets to investigate the question, "How have snow conditions in the East River Watershed changed over time?"

Megafires: Rare Occurrences or the New Normal?
Over the past few years, the media has given a lot of attention to large wildfires known as "megafires". But are megafires a new phenomenon? In this Data Puzzle, students study the environmental conditions that lead to megafires and analyze a megafire frequency dataset to investigate the question, "How and why has the number of megafires changed over time?" Figure credit: DMCA.
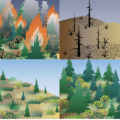
Wildfire, Drought, and the Future of Forests
Warmer and drier conditions have contributed to the rise in large wildifires that are burning huge swaths of forests across the US Rocky Mountains. In this Data Puzzle, students analyze post-fire recovery datasets to construct explanatory models for the following question, "How do climate conditions impact forest recovery after a wildfire?"

To Reflect or Not to Reflect
The color of Earth's surface determines how much of the Sun's energy is reflected or absorbed (albedo), with lighter-colored surfaces being more reflective than darker-colored surfaces. In this Data Puzzle, students analyze authentic Arctic datasets (albedo and sea ice extent) to investigate the question, "How might the Arctic’s albedo be affected by the observed decline in sea ice?" Figure credit: NASA.

Wind Farms of the Future
Transitioning from fossil fuels to clean, renewable energy sources like wind is essential if the US is to reduce its carbon emissions. But where should new wind farms be constructed? In this Data Puzzle, students analyze surface roughness and wind speed data to construct an evidence-based explanation for the investigative question, "Where in the United States (lands and waters) should new wind turbines be constructed to generate the most energy?" Figure from Wikimedia.
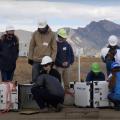
Windstorms on the Front Range
In 2022, strong winds caused the Marshall Fire in Boulder County, Colorado to quickly become the most costly wildfire in Colorado history. Although strong windstorms are a common weather event at the foot of the Rocky Mountains, a particularly windy month soon after the fire had the public feeling on-edge and scientists wondering “Is it becoming windier on the Front Range as the climate warms?" In this data puzzle, students analyze windstorm and red flag warning data to evaluate changing wind conditions on Colorado's Front Range.
On a Budget
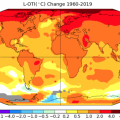
Rising global temperatures over the past century indicate that Earth’s energy budget is out of balance. However, not all warming is equal. The Arctic, a vast frozen ocean, is heating up faster than the global average! In this Data Puzzle, students analyze incoming shortwave and outgoing longwave energy to and from the Arctic to investigate the question, "Why might the Arctic be warming faster than other places on Earth?" Figure credit: NSIDC.

It's All Connected
What makes the Arctic climate system so unique is the sea ice, which influences the Arctic climate in many ways. In this Data Puzzle, students analyze a humidity dataset captured by a drone during the historic MOSAiC Arctic expedition to investigate the question, "What effect, if any, do leads (cracks in the sea ice) have on the transfer of moisture between the Arctic Ocean and atmosphere?" Image credit: Calle Schonning.
Balancing Act - Changes to the Greenland Ice Sheet
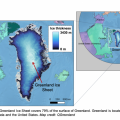
Since the early 2000s, the Greenland Ice Sheet’s mass balance has been consistently negative, meaning more mass is being lost than gained. But this change in mass balance hasn’t always happened at the same rate. In this Data Puzzle, students analyze temperature, snowfall, and meltwater rate datasets to investigate the question, "What factors are contributing to changes to the Greenland Ice Sheet in recent decades?"

Tracing Carbon Through the Arctic Food Web
Despite average winter temperatures of -30°F and being covered by sea ice for much of the year, the Arctic is home to a huge variety of living things (humans included) that have adapted to these harsh conditions. However, environmental conditions are changing. The Arctic is warming at a rate twice as fast as the global average and as a result, sea ice is melting rapidly.
Weather vs. Climate: Extreme Cold in a Warming World?
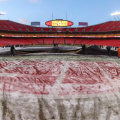
In this Data Puzzle, students explore the difference between weather and climate in the context of an extreme cold event that occurred during a NFL playoff game between the Kansas City Chiefs and Miami Dolphins on January 13th, 2024. The air temperature at kickoff was -4°F, making it the fourth coldest NFL game ever played! But what does this cold weather event tell us (if anything) in the context of long-term average temperature patterns in the region?