Data Puzzle Collection
Data Puzzles are all suitable for middle and high school classrooms. Most Data Puzzles require upwards of two 60-minute class periods to complete. Each Data Puzzle is connected to a specific scientist who has contributed their own or related real datasets for the activity.
The Data Puzzle team will be building out even more activities in the near future, so check back often. Have feedback or interested in seeing a specific Data Puzzle? Contact us at Datapuzzles@colorado.edu.
Data Puzzle: The Tipping Point
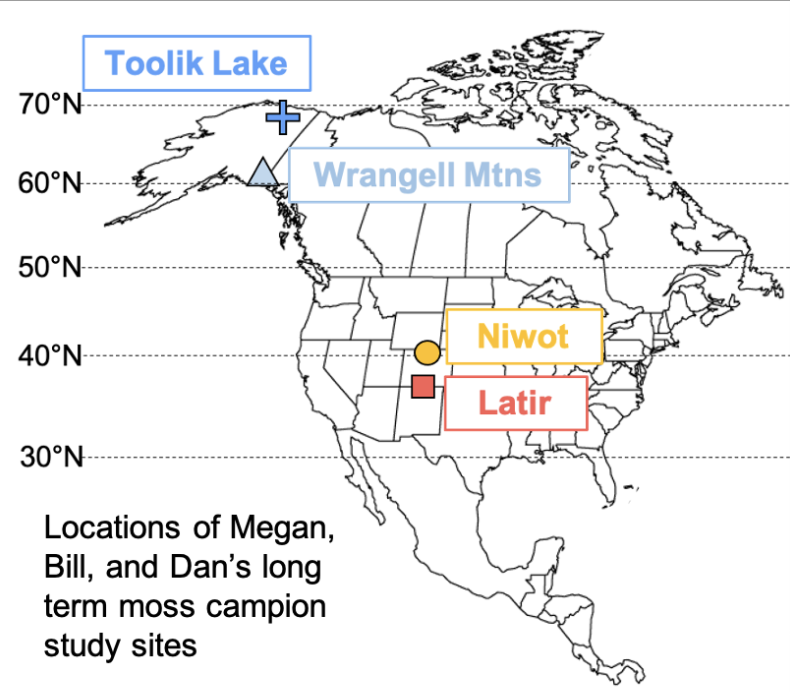
Moss campion is a hearty tundra plant that lives over a wide range of latitudes from New Mexico all the way up to Alaska. For more than twenty years, ecologists have been tracking the vital rates (survival, growth, and reproduction) of moss campion from four study sites to investigate questions like, "How is moss campion reproduction affected by temperature?" Questions like this one can give scientists insight into how these plants might be impacted by climate change.
Scientists: Ecologists Dr. Bill Morris (Duke University), Dr. Megan DeMarche (University of Georgia), and Dr. Dan Doak (University of Colorado Boulder)
Dataset(s): Moss campion reproduction rate and average July temperatures
NGSS Standards: LS4.C: Adaptations; LS2.C: Ecosystem Dynamics, Functioning, and Resilience; ESS2.D: Weather and Climate
Teacher Guide
Slide Deck
Student Worksheet
Data Puzzle: Megadrought in the Colorado River Basin
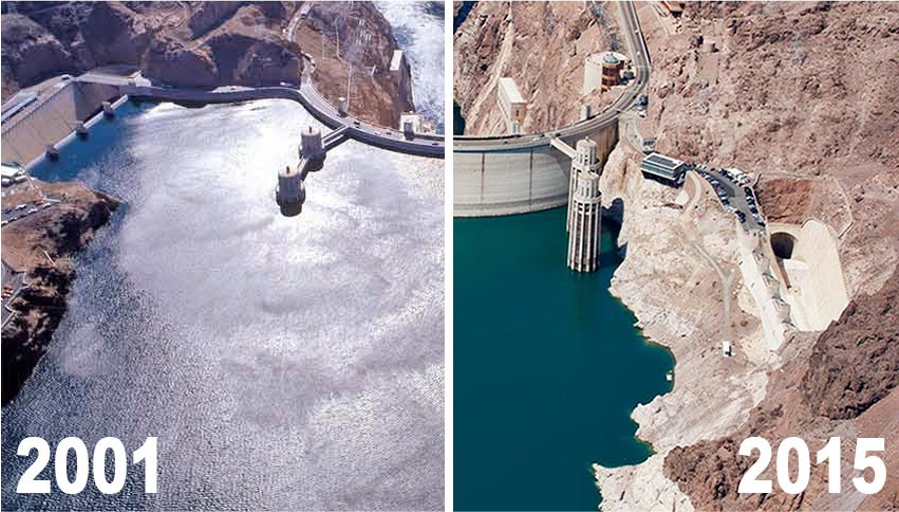
Much of the western United States is experiencing drought conditions. In this Data Puzzle, students analyze authentic climate data to construct explanatory models for the following question, "What is causing the megadrought in the Colorado River Basin?" Figure credit: National Park Service
Scientist: Seth Arens, Utah Research Integration Specialist for the Western Water Assessment
Dataset(s): Colorado River Basin temperature and precipitation over time
NGSS Standards: ESS2.D: Weather and Climate
Teacher Guide
Slide Deck
Student Worksheet
Data Puzzle: Megafire - Rare Occurrences or the New Normal?
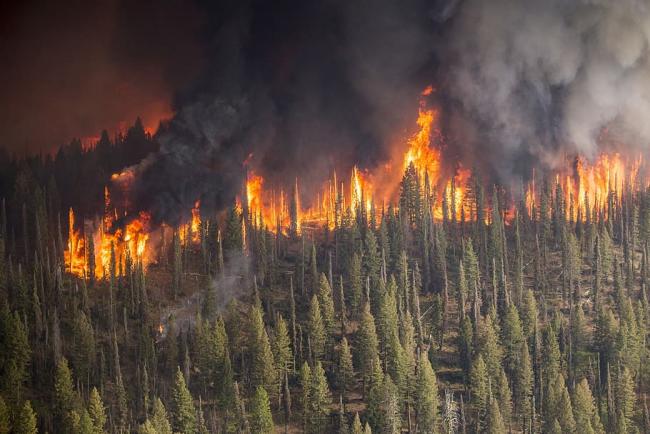
Over the past few years there has been a lot of attention in the media given to large wildfires known as, “megafires”. But are megafires a new phenomenon? How and why has the number of megafires changed over time? Figure credit: DMCA
Scientist: Dr. Natasha Stavros, Fire Ecologist at the University of Colorado Boulder
Dataset(s): Megafire frequency over time
NGSS Standards: ESS2.D: Weather and Climate
Teacher Guide
Slide Deck
Student Worksheet
Data Puzzle: Tracing Carbon Through the Arctic Food Web
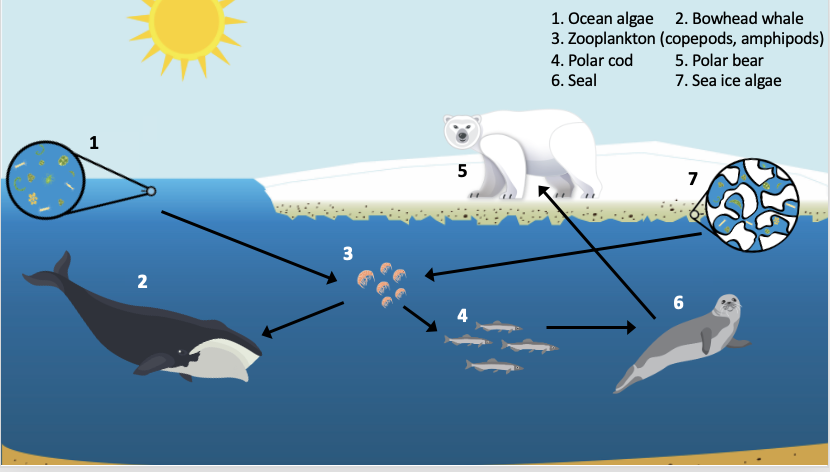
Despite average winter temperatures of -30°F and being covered by sea ice for much of the year, the Arctic is home to a huge variety of living things (humans included) that have adapted to these harsh conditions. However, environmental conditions are changing. The Arctic is warming at a rate twice as fast as the global average and as a result, sea ice is melting rapidly. Scientists are racing to learn more about the changing Arctic climate system with some ecologists investigating the question, "How might the decline in sea ice affect Arctic organisms large and small?"
Scientist: Arctic Ecologists
Dataset(s): Relative percentages of carbon-based fats (produced by sea ice and ocean algae) collected from various Arctic organisms.
NGSS Standards: LS2.B Cycles of Matter and Energy Transfer in Ecosystems
Teacher Guide
Slide Deck
Student Worksheet
Data Puzzle: On a Budget
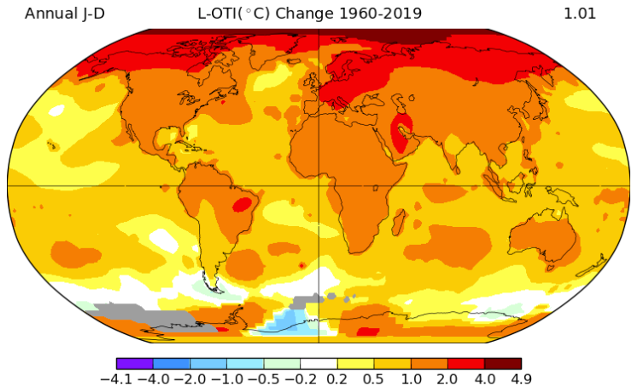
Rising global temperatures over the past century indicate that Earth’s energy budget is out of balance, with the Arctic heating up at a rate faster than the global average. What can the amount of incoming shortwave and outgoing longwave energy to and from the Arctic tell us about Arctic amplification? Figure credit: NSIDC
Scientist: Dr. Jen Kay, Atmospheric Scientist at the University of Colorado Boulder
Dataset(s): Incoming shortwave radiation (energy from the Sun) and Arctic temperatures over time
NGSS Standards: ESS2.D: Weather and Climate
Teacher Guide
Slide Deck
Student Worksheet
Data Puzzle: To Reflect or Not To Reflect
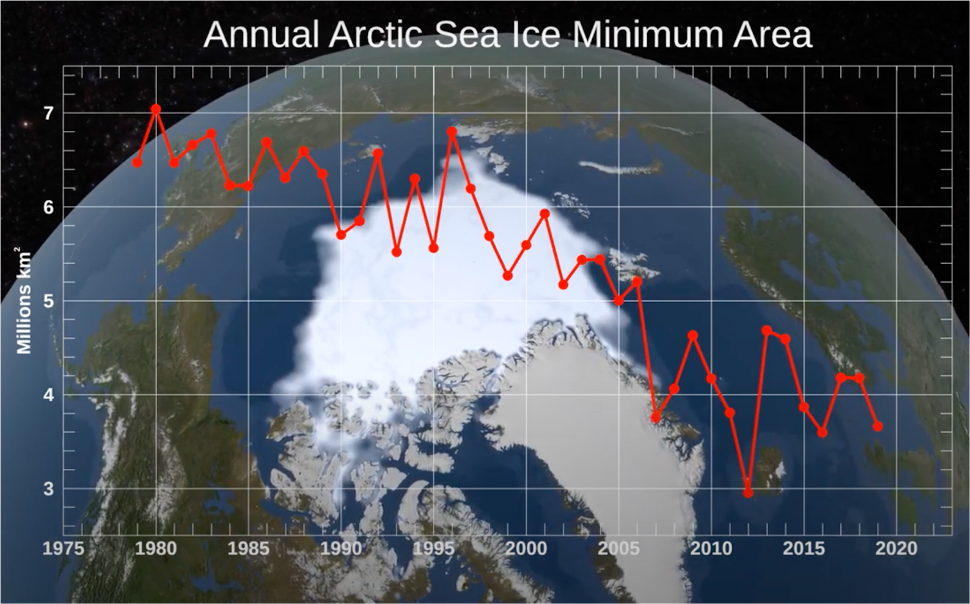
The color of Earth's surface determines how much of the Sun's energy is reflected or absorbed, where lighter-colored surfaces are more reflective. How might the Arctic’s albedo be affected by the observed decline in sea ice? Figure credit: NASA
Scientist: Dr. Jen Kay, Atmospheric Scientist at the University of Colorado Boulder
Dataset(s): Albedo and average September sea ice extent in the Arctic over time
NGSS Standards: ESS2.D: Weather and Climate
Teacher Guide
Slide Deck
Student Worksheet
Data Nugget
Data Puzzle: It's All Connected
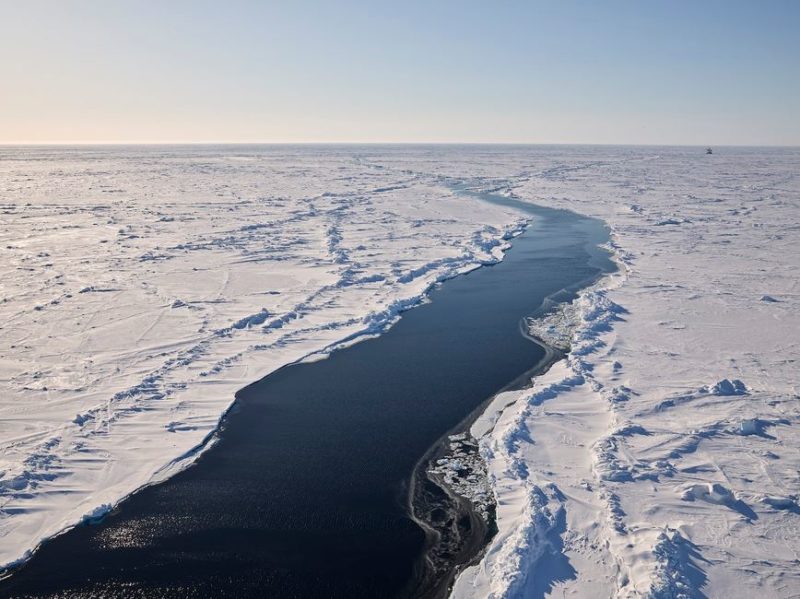
What makes the Arctic climate system so unique is the sea ice, which influences the Arctic climate in many ways. What effect, if any, do leads (cracks in the sea ice) have on the transfer of moisture between the Arctic ocean and atmosphere? Photo credit: Michael Gutsche, AWI
Scientist: Gina Jozef, Ph.D. student and drone pilot at the University of Colorado Boulder
Dataset(s): Humidity measurements upwind, downwind, and over an Arctic sea ice lead (crack) at various altitudes
NGSS Standards: ESS2.C: The Roles of Water in Earth's Surface Processes; ESS2.D: Weather and Climate
Teacher Guide
Slide Deck
Student Worksheet
Data Puzzle: Wind Farms of the Future
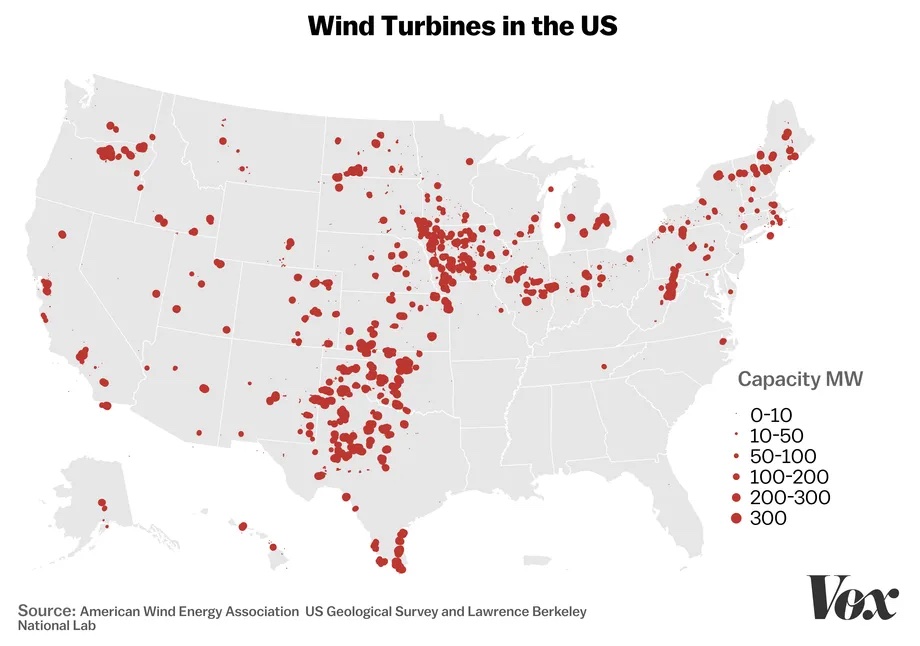
Transitioning from fossil fuels to clean, renewable energy sources like wind is essential if the US is to reduce its carbon emissions. But where should new wind farms be constructed? In this Data Puzzle, students analyze surface roughness and wind speed data to construct an evidence-based explanation for the investigative question, "Where in the United States (lands and waters) should new wind turbines be constructed to generate the most energy?"
Scientist: Julie Lundquist, an atmospheric scientist from the University of Colorado Boulder
Dataset(s): Offshore wind speeds and energy demand data from a hot, summer day (August 2nd, 2022) in New York City
NGSS Standards: ESS3.D Global Climate Change
Teacher Guide
Slide Deck
Student Worksheet
Data Puzzle: Heatwaves, Air Conditioning, and Offshore Wind Energy
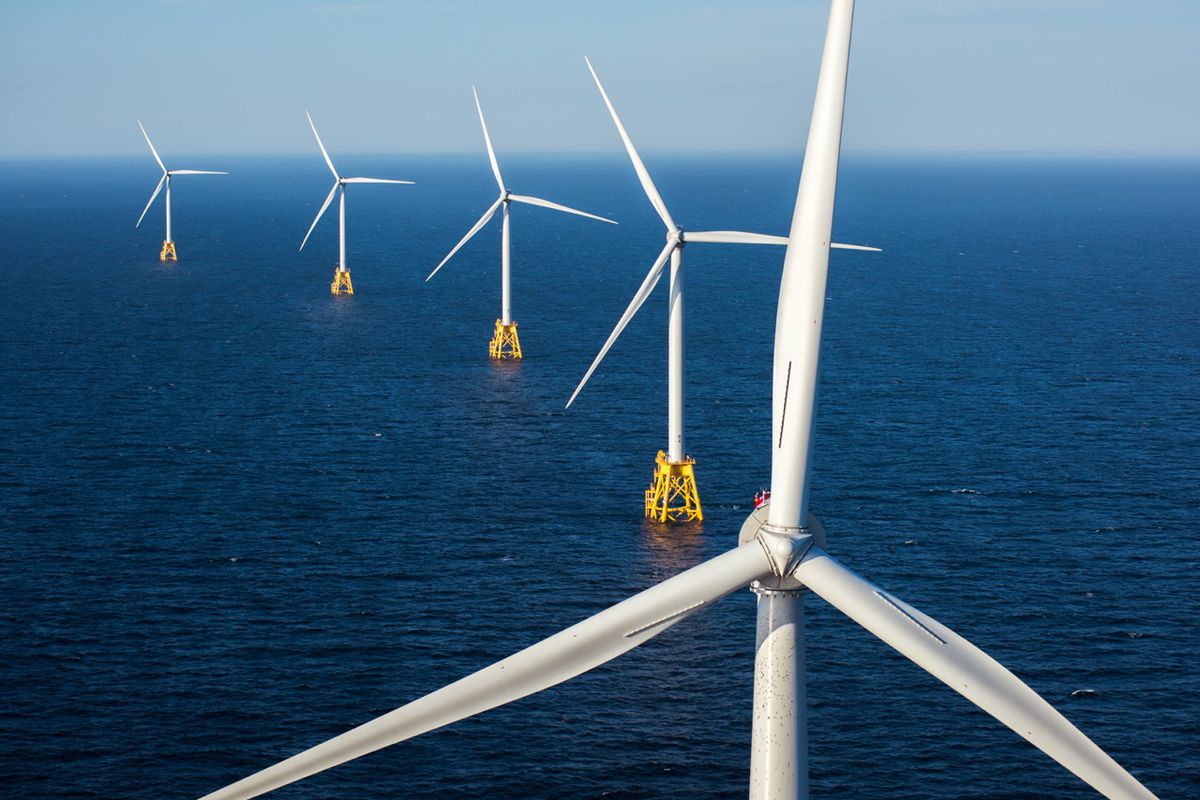
Understanding offshore wind patterns can help scientists predict when wind speeds are likely to be highest, and therefore when future offshore wind farms would be capable of producing the most energy. In this Data Puzzle, students analyze wind speed and energy demand data to explain the investigative question, "How does the timing of peak offshore wind speeds compare with the timing of peak energy demands in New York City during a hot, summer day?"
Scientist: Julie Lundquist, an atmospheric scientist from the University of Colorado Boulder
Dataset(s): Offshore wind speeds and energy demand data from a hot, summer day (August 2nd, 2022) in New York City
NGSS Standards: ESS3.D Global Climate Change
Teacher Guide
Slide Deck
Student Worksheet
Data Puzzles™ are produced by
![]()