To Reflect or Not to Reflect, That is the Question

Overview

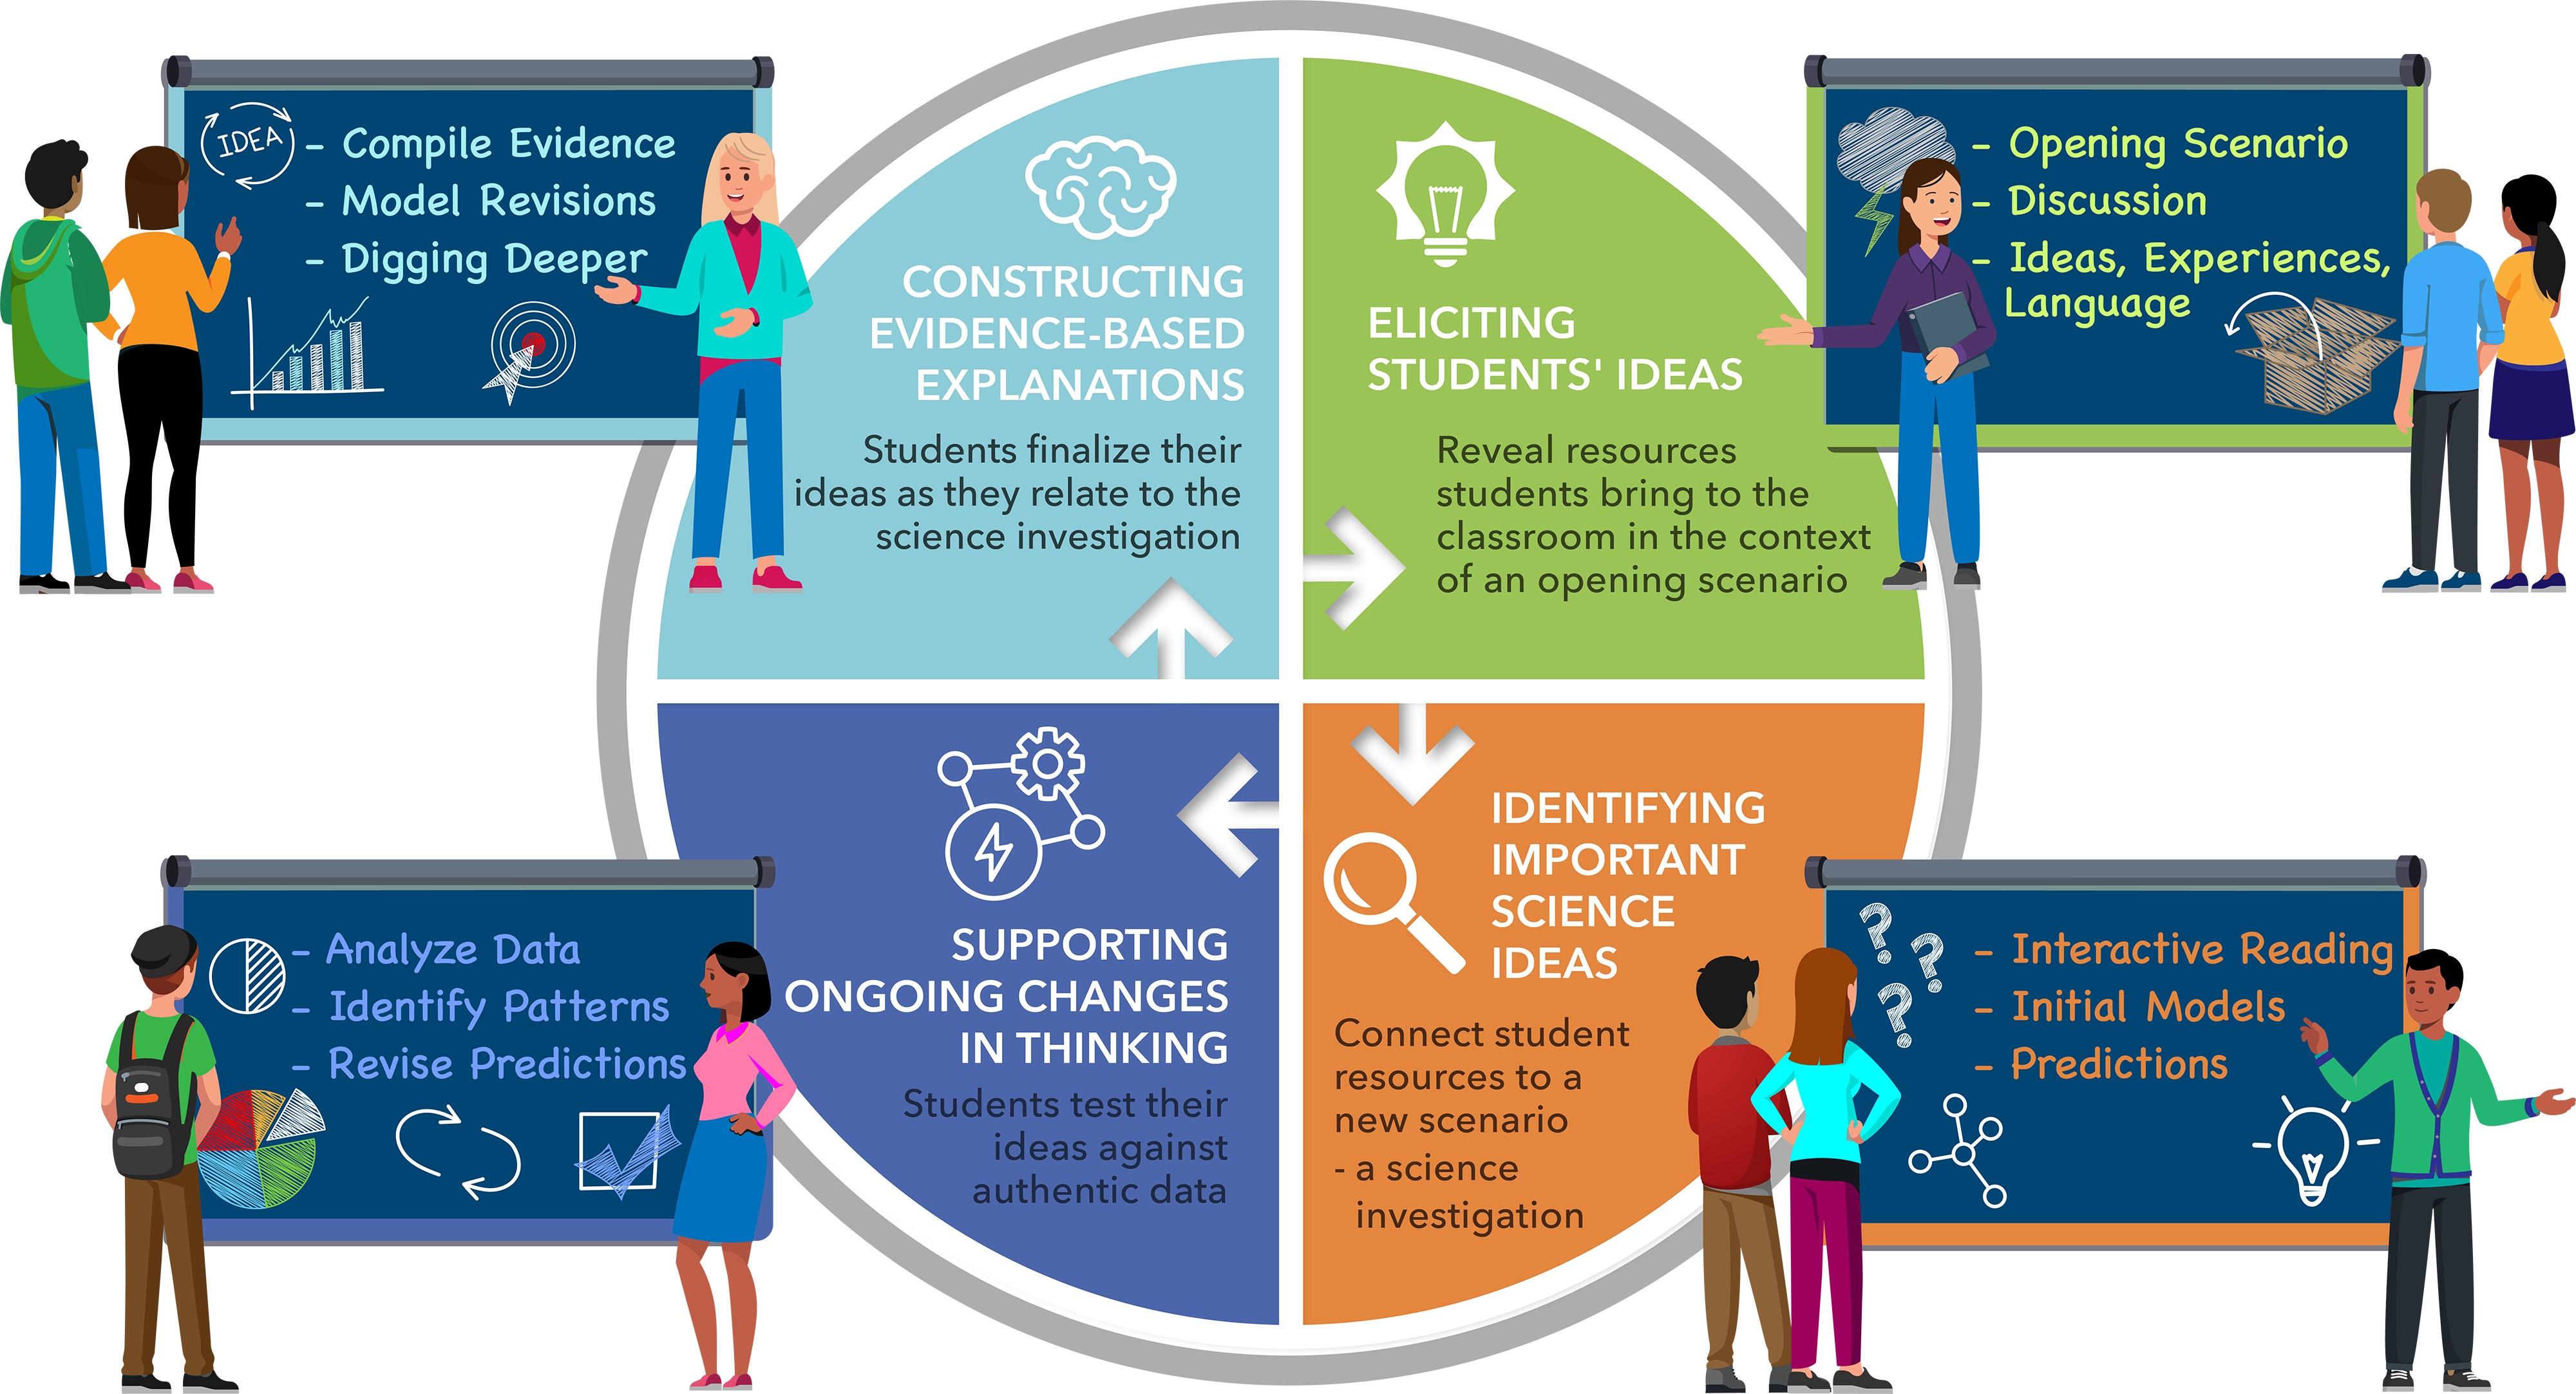
In this virtual workshop, we will review strategies for how to facilitate the To Reflect or Not to Reflect, That is the Question Data Puzzle in your middle and high school science classrooms. Participants will engage with the teaching materials (teacher guide, slide deck, student worksheet, and answer key) from both the teacher and student perspective and upon completion, be prepared to implement the Data Puzzle in their classroom.

Participants seeking a 3-hour PD certificate from the University of Colorado Boulder for completing the To Reflect or Not to Reflect, That is the Question virtual PD should submit their answers to the questions/tasks below using this Google Form


Please email jonathan.griffith@colorado.edu when you have submitted your Form.

Data Puzzles infographic

What are Data Puzzles?

Data Puzzles combine classroom-friendly datasets with the research-backed instructional practices of Ambitious Science Teaching to help students make sense of the natural world. If this is your first time learning about Data Puzzles we encourage you to read through our Instructional Framework page on the Data Puzzles website so that you can understand how the Ambitious Science Teaching instructional practices are integrated into these sensemaking lessons.

About the To Reflect or Not to Reflect, That is the Question Data Puzzle

Reflection diagram

Instructional Overview

Grade levelMiddle and High School
Instructional time~120 minutes
Investigative questionHow might the Arctic’s albedo be affected by the observed decline in sea ice?
Science ideas
  • Earth’s energy budget
  • Climate change
NGSS connections

Disciplinary Core Ideas

  • ESS2.D: Weather and Climate

Science and Engineering Practices

  • Analyzing and interpreting data
  • Constructing explanations

Crosscutting Concepts

  • Energy and Matter
  • Cause and Effect
  • Stability and change

Pre-workshop tasks

The Data Puzzle includes three main components, it is important to understand the differences between the materials. BEFORE you dive into the virtual workshop, please complete the following tasks:

  • Open the teacher guide. Note that the teacher provides some short facilitation tips and some additional materials you can use to differentiate the curriculum.
  • Flip through the slide deck. Note that the opening scenario is only on the slides, not on the student worksheet. 

Print the student worksheet. Note that the student worksheet has the background reading and space for students’ models.

Part 1: Eliciting Students’ Ideas

Image

Overview Video

The goal of this first Data Puzzle practice is to elicit student resources (ideas, experiences, and language) about an opening scenario (e.g., prompt, image, demo, video) that encourages students to think about a science idea in the context of their own life before they explore this same science idea in the context of the Data Puzzle. Note that Part 1 (Opening Scenario) does not appear on the student worksheet. Instead it is meant to be facilitated before the student worksheet is distributed to students (see slides and teacher guide).


The following video is an overview of the Eliciting Students’ Ideas practice in the context of the To Reflect or Not to Reflect, That is the Question Data Puzzle and includes facilitation strategies and discourse moves.

Image

Why it’s important

Student resources (ideas, experiences, and language) serve as the foundation upon which new science ideas can be reconstructed and reorganized. Revealing these resources expands the range of ideas available to the entire class and allows teachers to adapt further instruction to help connect student resources to new and abstract science ideas. Find more information about the Eliciting Students’ Ideas practice here.

Now that you understand the goal of the Eliciting Students’ Ideas practice and have heard some tips about how to facilitate the opening scenario, it’s time for you to think about how you might implement this practice in your own classroom by reflecting on the opening scenario and “Stop and Think” questions below.

Image

Image

Image

Stop and Think

  • How do you think your students will respond to this opening scenario prompt?
  • Would you have students engage with the opening scenario as a warm up prompt they respond to in their notebooks? Think-pair-share? Small group white boarding activity?
  • When facilitating a discussion about this opening scenario prompt, what key ideas might you listen for and mark to be used as a resource later in the Data Puzzle?

Image

Stop and Think

How can you support your students in making the connection between cities painting their rooftops white and how the growth and decline of Arctic sea ice might impact the amount of sunlight reflected in the region.

Connecting student resources to the Data Puzzle

After bringing out student resources about the opening scenario, it’s important to help students make connections between the opening scenario and the science investigation they are about to engage with in the Data Puzzle. Embedded in the slide deck are specific discussion prompts to help students make these connections and a slide (see below) that introduces the Data Puzzle featured scientist, atmospheric scientist Jen Kay, who uses satellite data to understand how the amount of sunlight reflected from the Arctic might be changing in response to melting sea ice.

It's time to learn more about the featured scientists’ research by engaging with the interactive reading as part of the next practice, “Identifying Important Science Ideas."

Part 2: Identifying Important Science Ideas

Image

Overview Video

In this practice, students engage with an interactive reading that we call the “puzzle plot”. The goal of this practice is to have students explore new science ideas they’ll need to explain a question the featured scientist(s) are investigating.

  • At this point teachers should distribute the student worksheet to be used for Parts 2,3, and 4.

The following video is an overview of the Identifying Important Sciences Ideas practice in the context of the To Reflect or Not to Reflect, That is the Question Data Puzzle and includes facilitation strategies and discourse moves.

Image

Why it’s important

Many science ideas are abstractions that go beyond the students’ personal experiences and current understandings. These abstract ideas must be presented by teachers (direct instruction) as tools students will reason with as they seek to make sense of the investigative question featured in the Data Puzzle’s interactive reading. Find more information about the Identifying Important Science Ideas practice here.

Now that you understand the goal of the Identifying Important Science Ideas practice and have heard some facilitation strategies, it’s time for you to think about how you might implement this practice in your own classroom by completing a series of tasks and reflecting on the “Stop and Think” questions below.

Interactive Reading

Image

Workshop task

Read and annotate the Puzzle Plot text - see student worksheet

Note that you may want to print and annotate the student worksheet directly if you are planning to submit the worksheet to receive a PD certificate.

Instructions: Open the Student Worksheet and read the Puzzle Plot text, pausing to analyze the embedded images. When reading the text, be sure to complete the following tasks (just as your students would do):

  • Circle the investigative question the scientists are seeking to answer
  • Underline similarities between the reading and the opening scenario 
Image

Stop and Think

  • How might you engage your students with this interactive reading? Would you have students read the text individually? Or would you, the teacher, read the text aloud to the whole class pausing to watch each of the videos together?
  • Would you incorporate close reading strategies that you may already use in your classroom?
  • How can you support students in identifying similarities and making connections between the science ideas presented in the puzzle plot text and the science ideas that were elicited from the opening scenario? 

Summarize Student Ideas

Image

Workshop task

Summarize science ideas - see student worksheet

Instructions: After facilitating a discussion to help students make connections between the ideas presented in the text and the student resources elicited during the opening scenario, it’s time to summarize these important science ideas by completing questions #1-3 (included below) on your student worksheet.

  1. Draw and describe how the sunlight shining on sea ice differs from sunlight shining on ocean water.
  2. Record the investigative question

Make a prediction (based on evidence from the text) about the investigative question

Image

Stop and Think

  • Would you have students work individually or in pairs to complete the student worksheet?
  • What challenges might your students encounter when making a prediction about the investigative question?

It's time to test your prediction for the investigative question by analyzing and interpreting a dataset collected by the featured scientist(s) as part of the “Supporting Ongoing Changes In Thinking" practice.

Part 3: Supporting Students Ongoing Changes in Thinking

Image

Overview Video

The goal of this practice is to provide students with an opportunity to test their initial predictions/understandings for the investigative question against real data.

The following video is an overview of the Supporting Ongoing Changes in Thinking practice in the context of the To Reflect or Not to Reflect, That is the Question Data Puzzle and includes facilitation strategies and discourse moves.

Image

Why it’s important

Students apply their knowledge to analyze and interpret an authentic dataset and understand that their explanations will likely have changed over time in response to new evidence. Find more information about the Supporting Ongoing Changes in Thinking practice here.

Now that you understand the goal of the Supporting Ongoing Changes in Thinking practice and have heard some facilitation strategies, it’s time for you to think about how you might implement this practice in your own classroom by completing a series of tasks and reflecting on the “Stop and Think” questions below.

How do scientists’ study Earth’s energy budget?

Before students are asked to test their predictions for the investigative question, “how might the Arctic’s albedo be affected by the observed decline in sea ice?” against real data (Arctic albedo and sea ice extent), it may be helpful to have students explore the satellites that are gathering these datasets by watching a video and interacting with these satellites.

Image

Workshop Task

CERES instruments have been launched aboard the Terra, Aqua, and S-NPP satellites to measure incoming solar energy and outgoing longwave (heat) energy from the Earth to better understand Earth’s energy budget. Watch the video and explore the NASA interactive below to learn more about the CERES project and to view the satellites carrying CERES instruments.

Image

Watch this NASA video (0-1:53 minutes) to learn more about the CERES instruments.

Image

Watch this NASA video to learn how the ICESat-2 satellite measures changes in the amount of ice on Earth.

NASA interactive thumbnail

Visit and explore the ICESat-2 satellites and the Terra, Aqua, and Suomi-NPP satellites (upon which CERES instruments are attached) with this NASA interactive

Introducing the dataset

Analyzing data is a challenging task for many students, especially when they  have not collected the dataset themselves.  What does a point represent? What do the axes mean? It’s important for students to be able to answer these and other questions BEFORE they are asked to identify patterns in a dataset.

Graph showing changes in incoming shortwave energy (energy from the Sun) and Arctic temperatures from 2000-2018.

Image

Stop and Think

  • How might you introduce the Arctic albedo and Arctic sea ice extent datasets (see graphs below) to your students? Consider using these prompts:
    • What does the black line represent?
    • What does the dashed line represent?
    • How many years of data are shown in the graph? 
    • Why are there two y-axes?
Image

Workshop Task

Identifying Patterns - see student worksheet

After facilitating a class discussion about the dataset, it’s time to identify patterns in the data and revise your prediction (based on evidence from the graph) for the investigative question by completing questions #4-8 on your student worksheet

Teacher Tip

We recommend creating a list of Back Pocket Questions (BPQ) that you could use as you move from table to table to help students focus on the task, recall earlier class discussions about a particular science idea, or to challenge students to connect any patterns they’ve identified back to the investigative question. See this practice document (page #4) for example BPQs.

Part 4: Constructing Evidence-Based Explanations

Image

Overview Video

The goal of this practice is to help students finalize new understandings as they relate to the investigative question presented in the Data Puzzle by constructing an explanatory model (annotated sketch).


The following video is an overview of the Constructing Evidence-Based Explanations practice in the context of the To Reflect or Not to Reflect, That is the Question Data Puzzle and includes facilitation strategies and discourse moves.

Image

Why it’s important

This final step allows students to pull together different ideas and bodies of evidence to revise and advance their current explanations for the investigative question. Find more information about the Constructing Evidence-Based Explanations practice here.

Now that you understand the goal of the Constructing Evidence-Based Explanations practice and have heard some facilitation strategies, it’s time for you to think about how you might implement this practice in your own classroom by completing a series of tasks and reflecting on the “Stop and Think” questions below.

Introducing Scientific Models

After gathering evidence (interactive reading and shortwave and longwave data interpretation), it’s time for students to construct a final model to explain the investigative question, “How might the Arctic’s albedo be affected by the observed decline in sea ice?” But what even is a model? If your students have not constructed a model in your classroom, use the slide deck to introduce the concept of a scientific model and to facilitate a discussion around what should be included in a model and what a model should look like.

Image

Workshop Task

Construct your final explanatory model - see student worksheet

After introducing scientific models, it’s time to construct your own model to represent the investigative question, “How might the Arctic’s albedo be affected by the observed decline in sea ice?” First, create a list of ideas and evidence that you just “gotta-have” in your final model. Then, refer to this list (also known as a “gotta-have checklist”) to construct your final explanatory model.

Image

Stop and Think

  • Sometimes it’s helpful to develop the “gotta-have checklist” together as a whole class before students construct their models. Do you think that your students would benefit from this level of scaffolding?
  • What challenges might students encounter when constructing their final models?
  • After students have constructed their final explanatory models, consider having students share their models with a partner, as a table group, or as a whole class via a gallery walk. What might this look like in your classroom?

Digging Deeper Questions

After students construct their final models for the investigative question, we challenge students to apply these new science ideas to new situations (e.g., social justice issues, climate solutions, or related phenomena) through a “Digging Deeper” question(s). We encourage you, the facilitator, to use these questions as is or adapt them to connect to topics you’ve previously covered in class or other local phenomena.

Image

Workshop Task

Digging Deeper questions - see student worksheet

Respond to question #10 on your student worksheet to consider how declining sea ice and the resulting decrease in the Arctic’s albedo might affect Arctic temperatures. 

Teacher Tip

Review the “Additional Teacher Materials and Extensions” section on the last page of the teacher guide for more information about the work presented in the To Reflect or Not to Reflect, That is the Question Data Puzzle and extension materials.

Conclusion

The To Reflect or Not to Reflect, That is the Question Data Puzzle is NOT intended to be an activity that is distributed to the student to be completed as homework. Instead, it is meant to be a collaborative effort by the teacher and students to make sense of new science phenomena. Before implementing the To Reflect or Not to Reflect, That is the Question Data Puzzle in your classroom it’s important to review all of the materials available to you (teacher guide, answer key, slide deck) and to be prepared to facilitate lots of small group and whole class discussions!

Image

Stop and Think

  • What challenges might you and/or your students encounter when engaging with To Reflect or Not to Reflect, That is the Question?
  • How will you move back and forth between the instructions and discussion prompts included in the slide deck and tasks students must complete on their worksheets?
  • Where might this Data Puzzle fit into your existing curriculum?
Image

Professional Development Certificate (submission guidelines)

To receive a PD certificate for completing this virtual workshop, please upload your completed student worksheet as a PDF to this Google Form. The Form also includes several questions designed to challenge you to articulate how you would implement this lesson in your classroom.